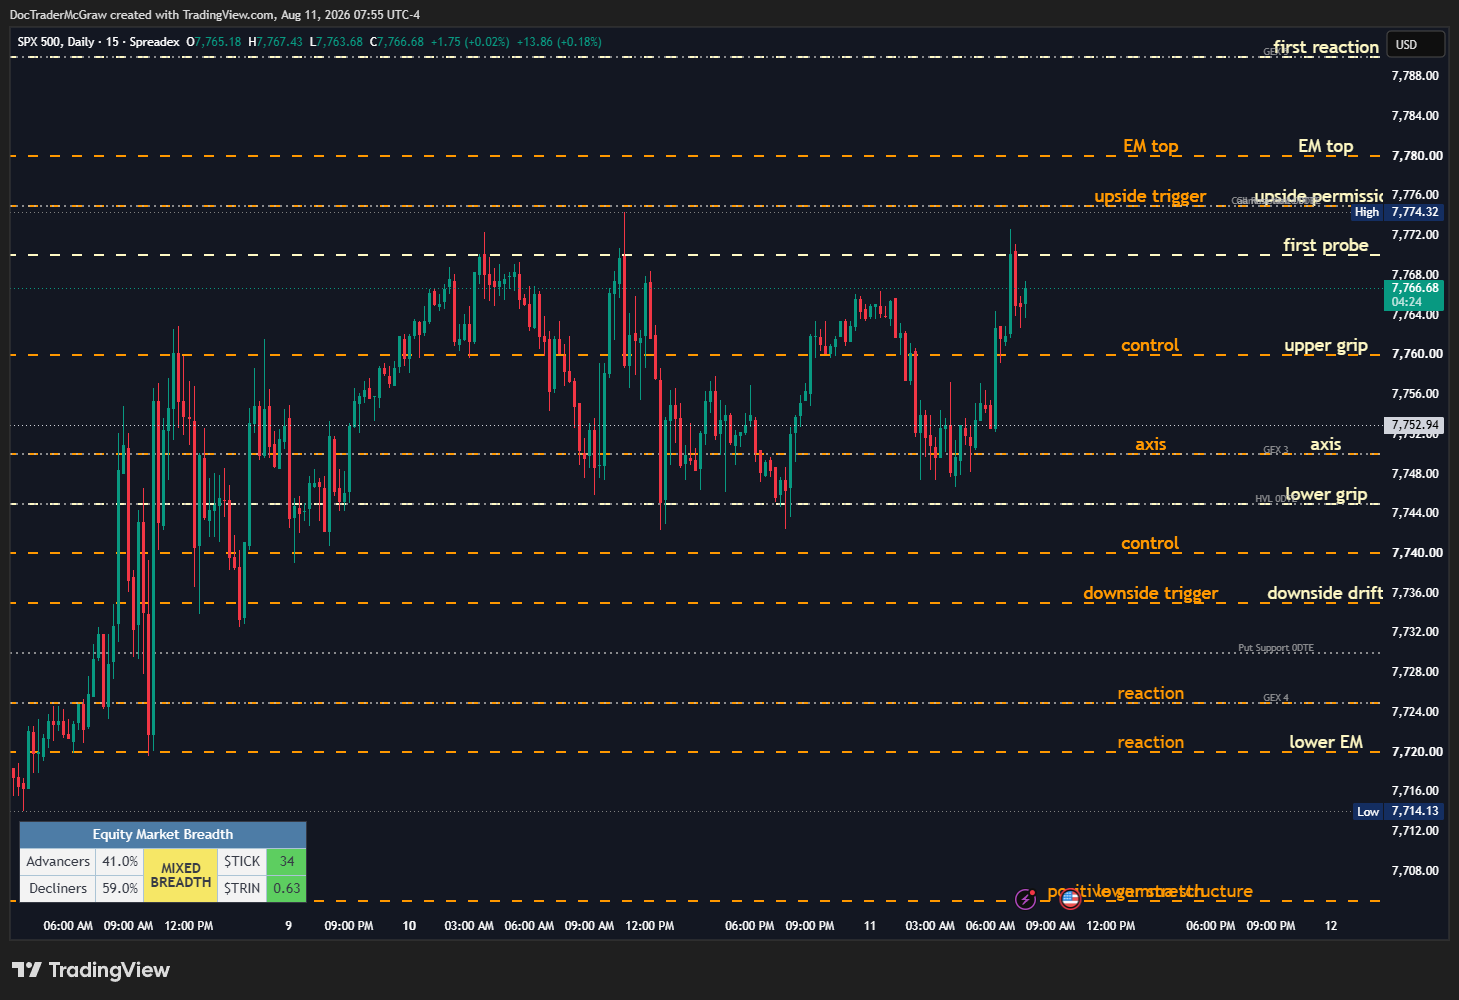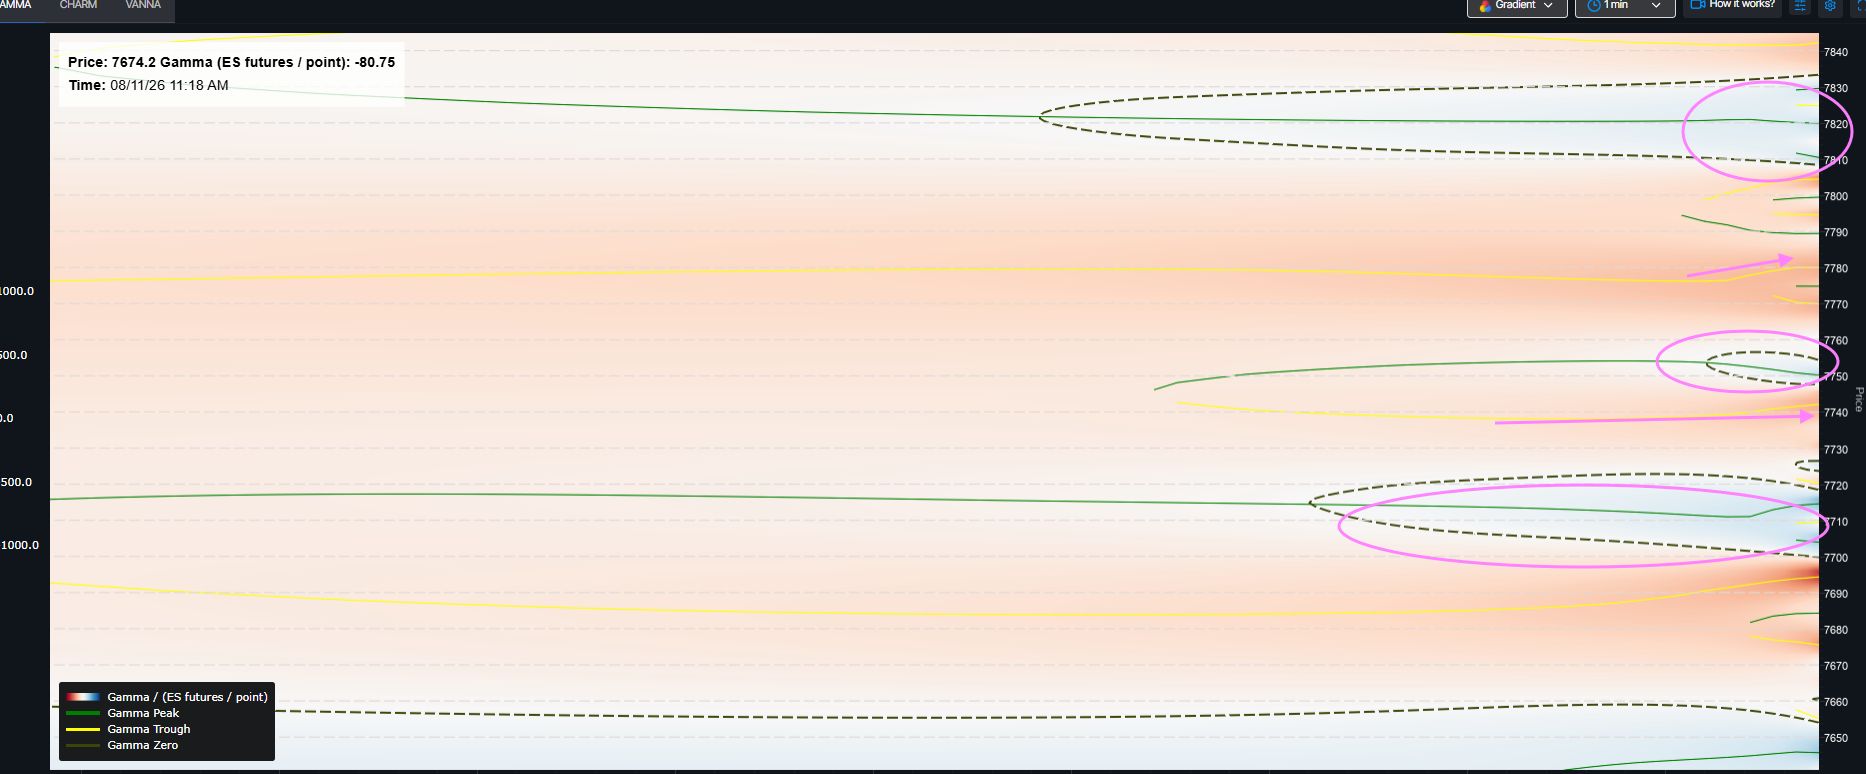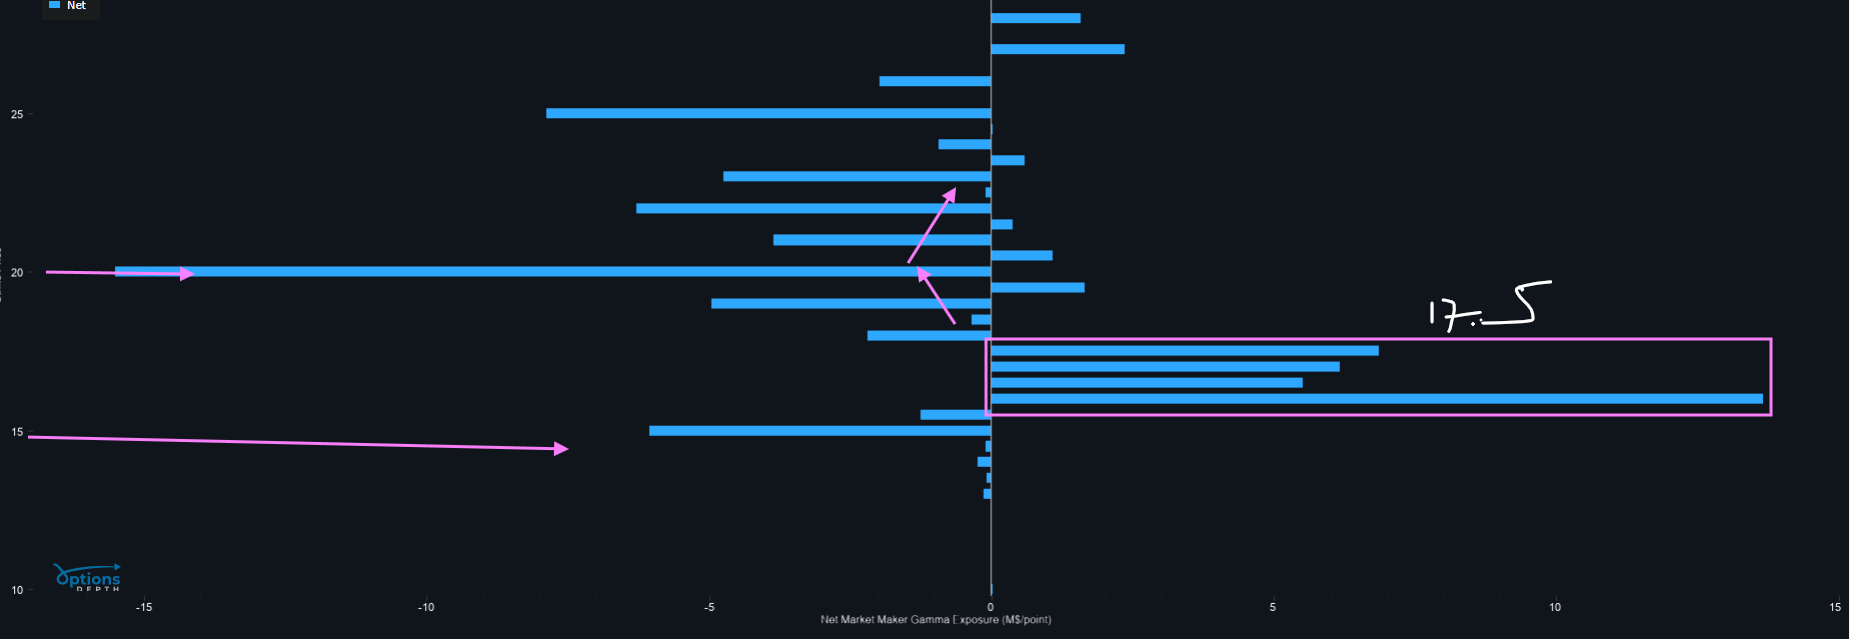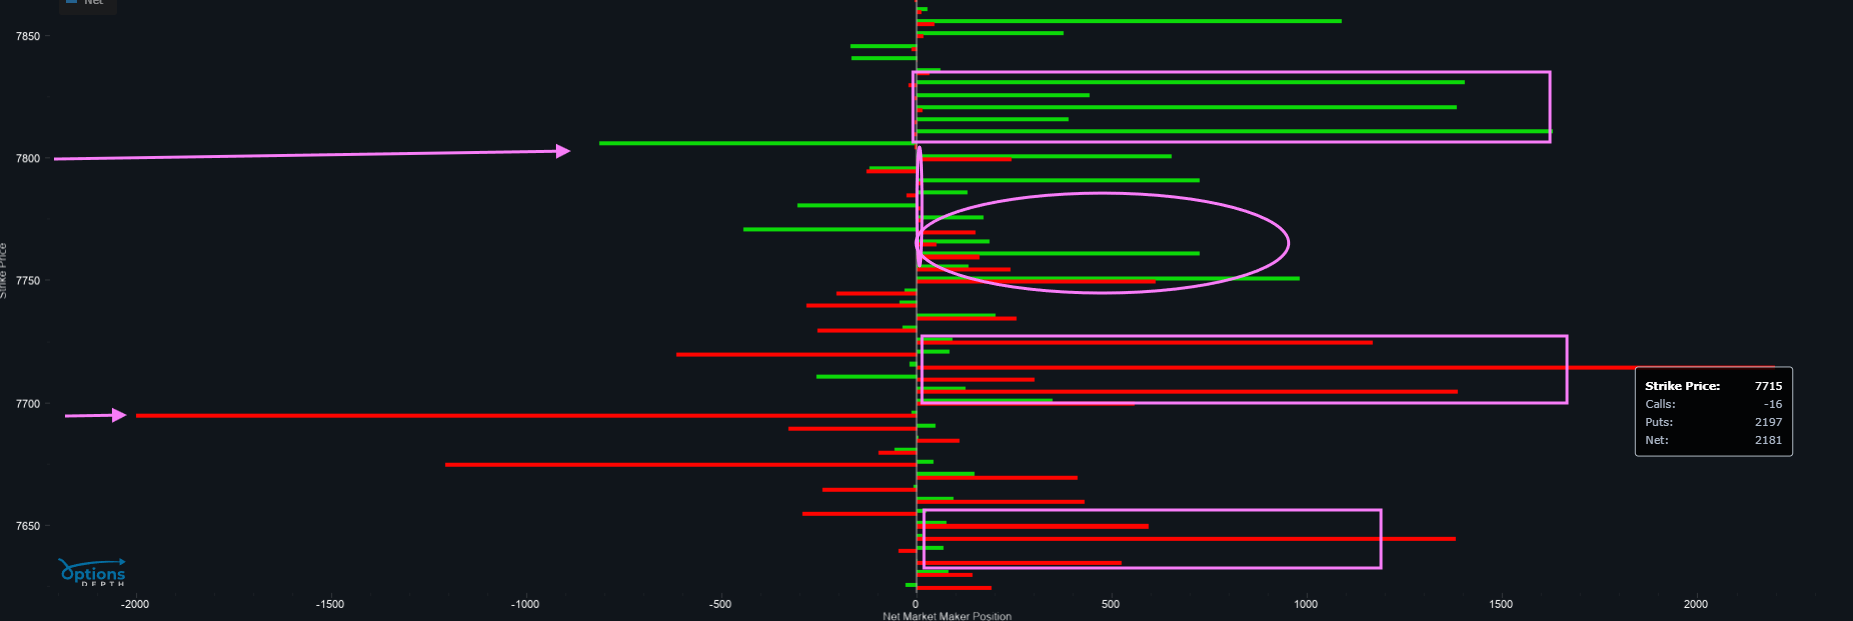
Doc McGraw's Options Gelt

5.0 (4 Reviews)
I trade flows over fundamentals—dealer positioning, gamma exposure, systematic flows. Market structure drives price action, not headlines. D...
Location hidden
Created byProfile pictureDoc McGraw
367 joined
Profile picture
Doc McGrawProfile picture@doctradermcgraw·1d

S&P 500 Tests 7700 on VIX Settlement Day — Can SPX Repair Before MOPEX?

SPX washed into the upper 7670s overnight, bounced back toward 7700, and now gets VIX settlement, a stacked earnings morning and FOMC minutes before Friday’s OPEX.

🔴 LIVE — 8:30 AM ET

YouTube Live
X/Twitter Live

👀 ABOVE THE FOLD

• SPX traded down to 7677.89 overnight and bounced back toward 7700 — buyers showed up, but the repair is not complete
7700 is today’s internal pivot inside a tighter 7690–7715 chop zone
• Today’s straddle is roughly 28.80, framing 7670 <> 7730; 1.5x sits near 7655 <> 7745
VIX settles this morning; the old /VX front month went out around 15.75 and the new front month begins near 18
• Inflation concerns are in the tape: crude bid, the 20- and 30-year recently hit multi-decade highs, and the 10-year is around 4.70%, just off its ~4.75% one-year high
$TGT, $LOW, $TJX, $EL and $ADI hit this morning, with FOMC minutes at 2:00 ET

🔁 If the Daily Plan helps you see the market more clearly, share or restack it. Someone else may be looking at the same chart and missing what is happening underneath it.

🧭 CONTEXT

Tuesday extended the break lower before buyers finally showed up overnight around 7678.

The bounce matters.

So does what it has not done yet.

SPX is back around 7700, but after losing that area Tuesday and again overnight, 7700 is no longer something I want to call automatic support. It is the first repair line.

Above it, price begins working back into Tuesday’s range.

Below it, the overnight bounce remains just that — a bounce.

The broader tape still has a rates problem.

Inflation concerns are in the tape. Crude remains bid, the 20- and 30-year recently pushed to multi-decade yield highs, and the 10-year is trading around 4.70%, just off its roughly 4.75% one-year high.

The pressure has been concentrated farther out the curve rather than in the front end. That continues to look more like term premium / duration pressure than a simple Fed-repricing story.

And the options book is giving us another layer.

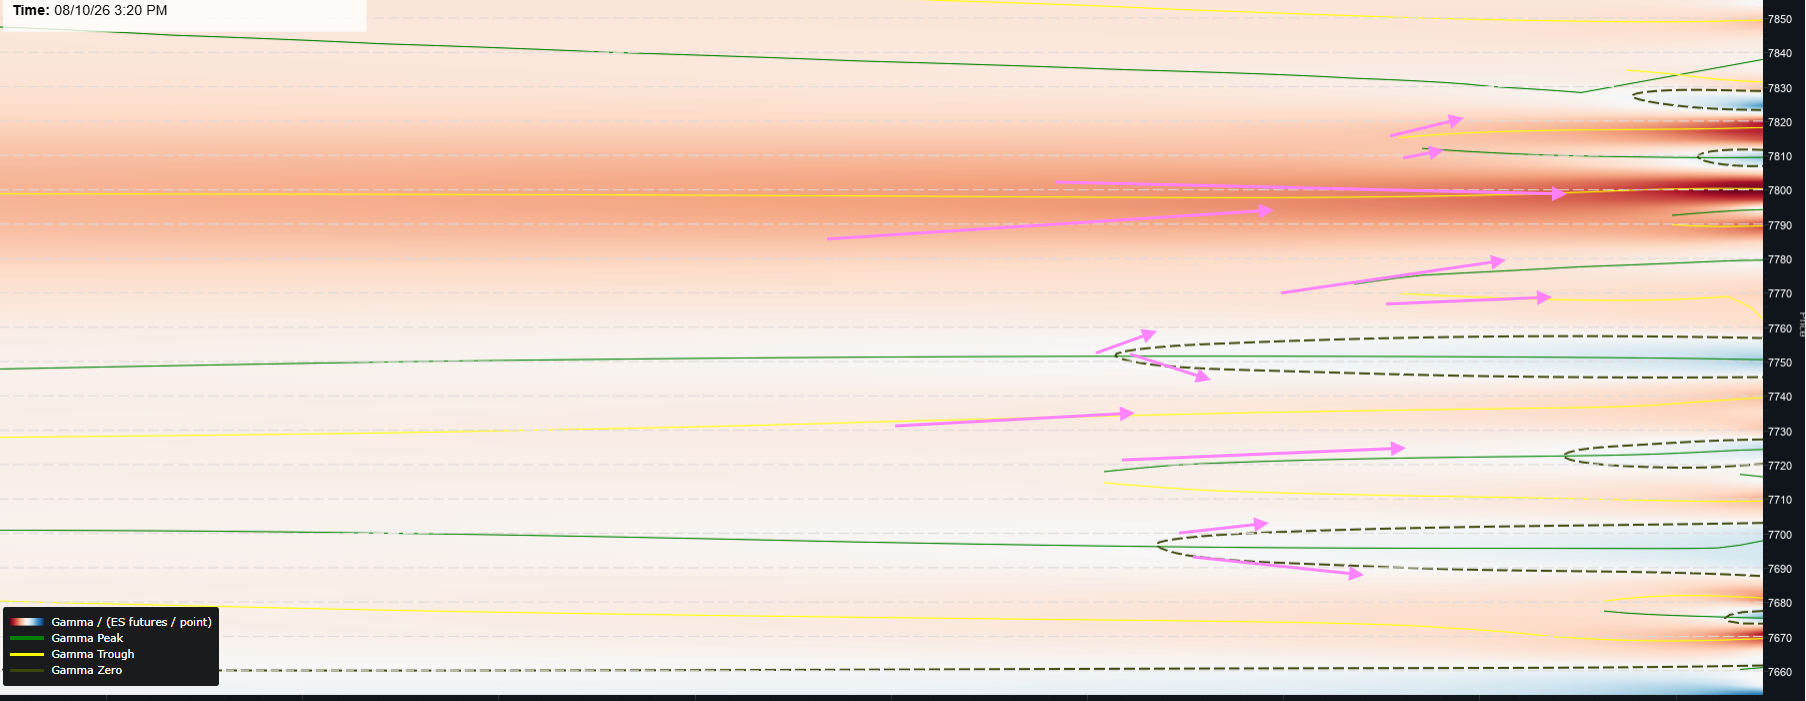
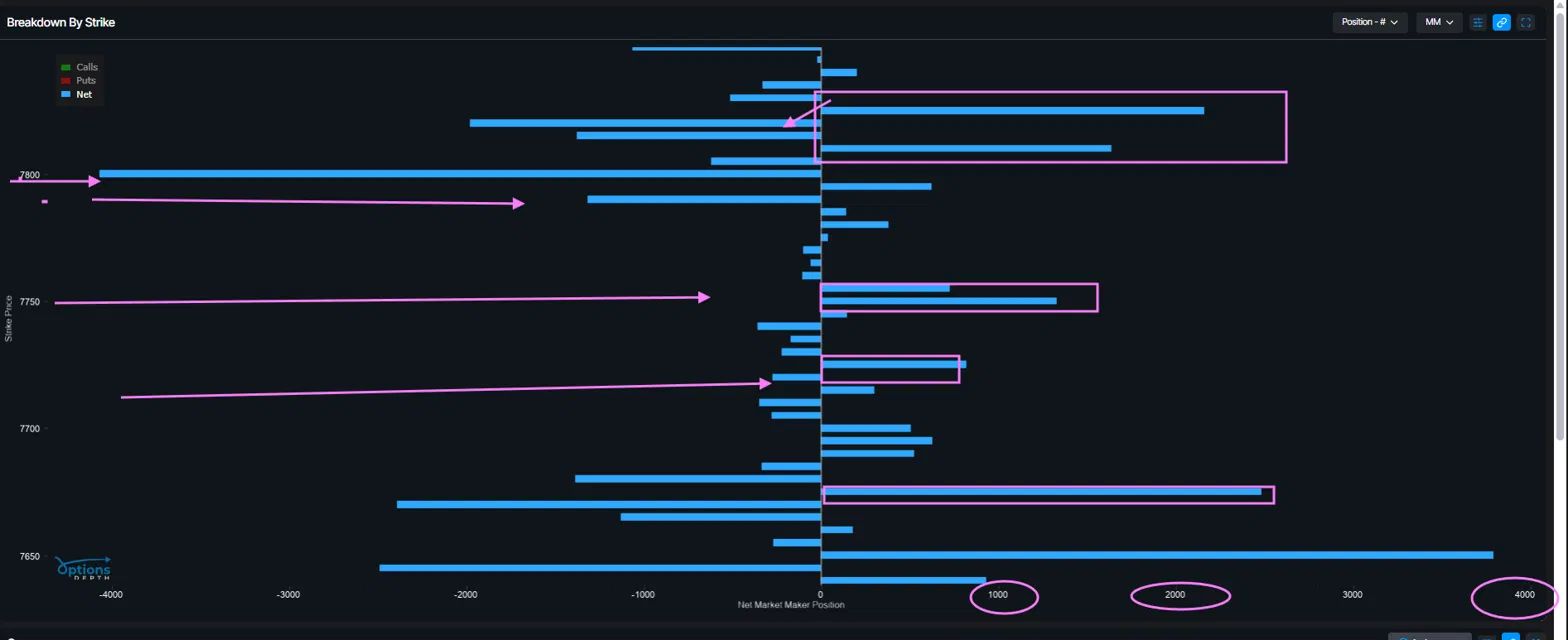
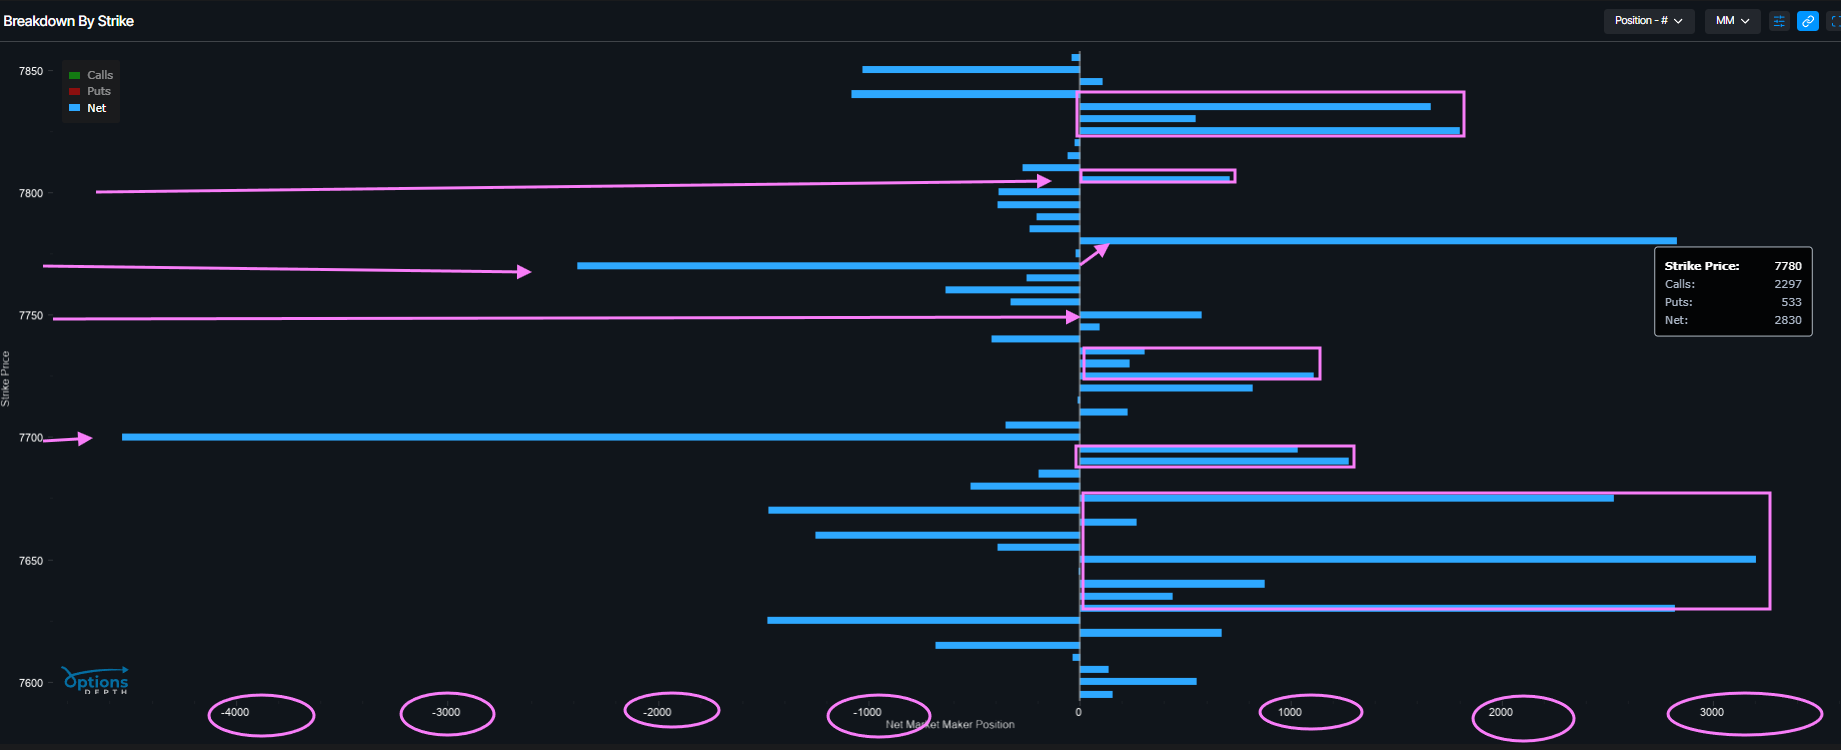
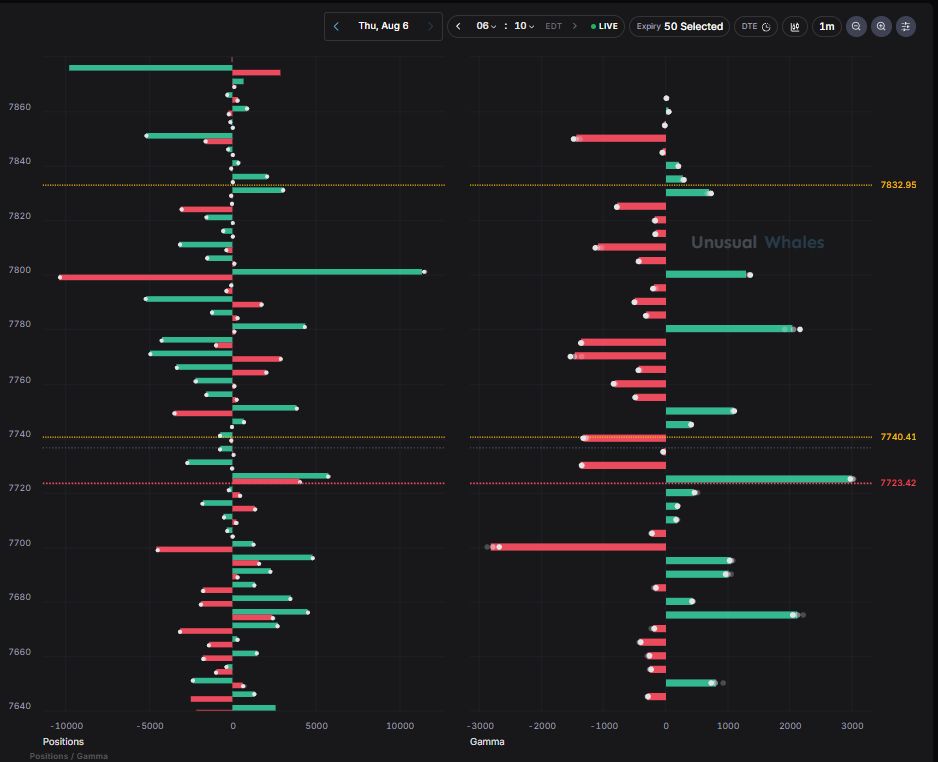
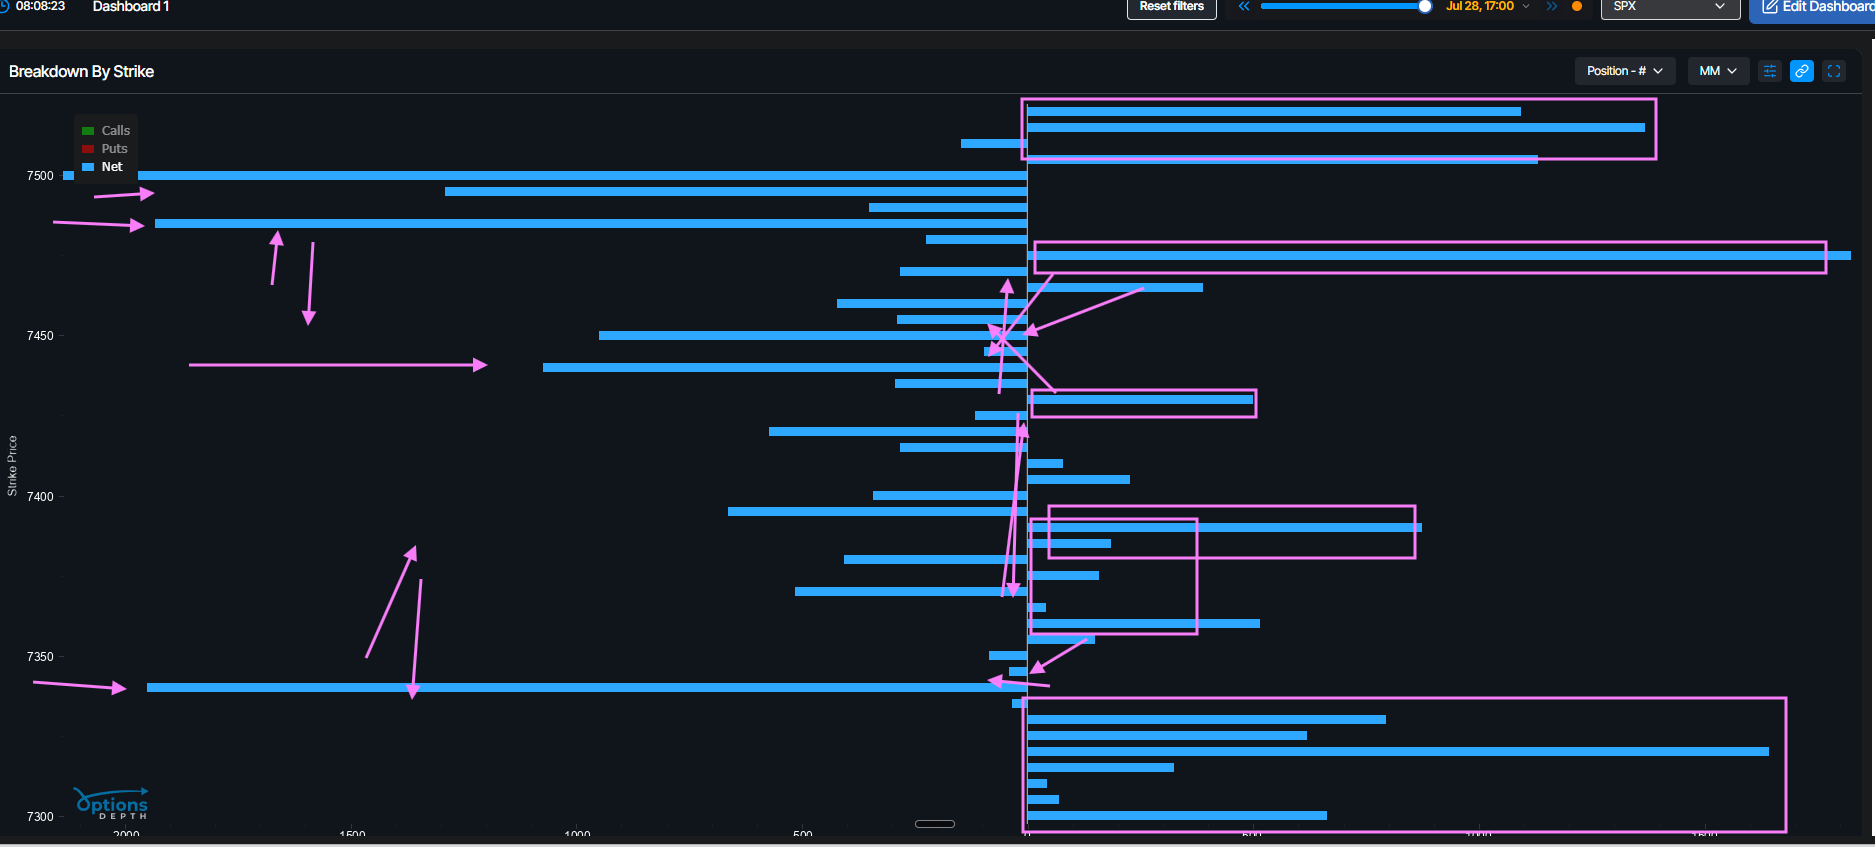
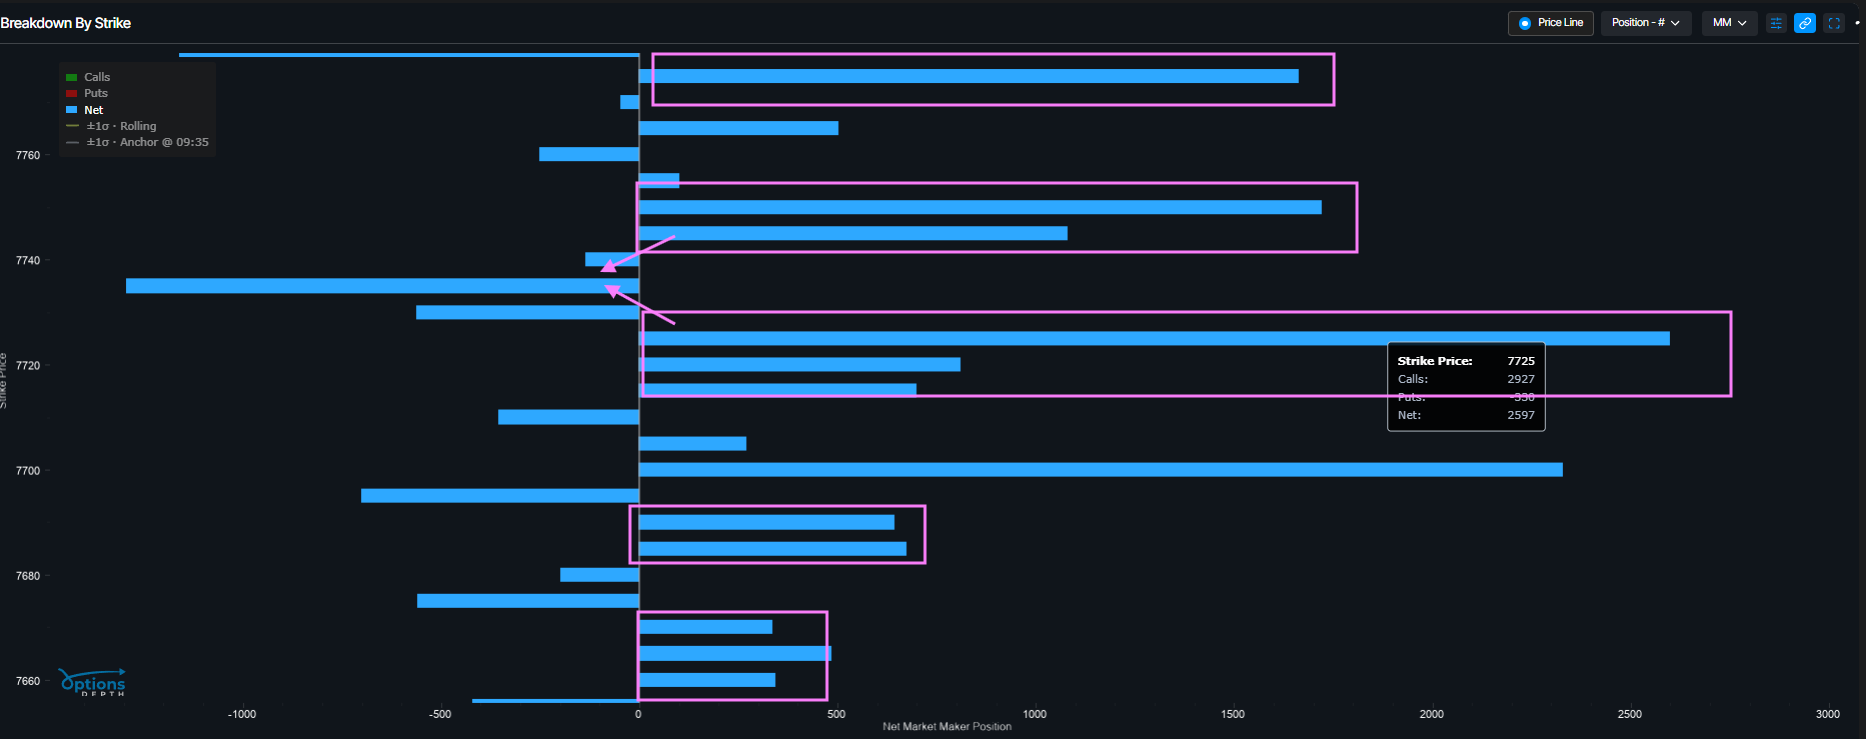
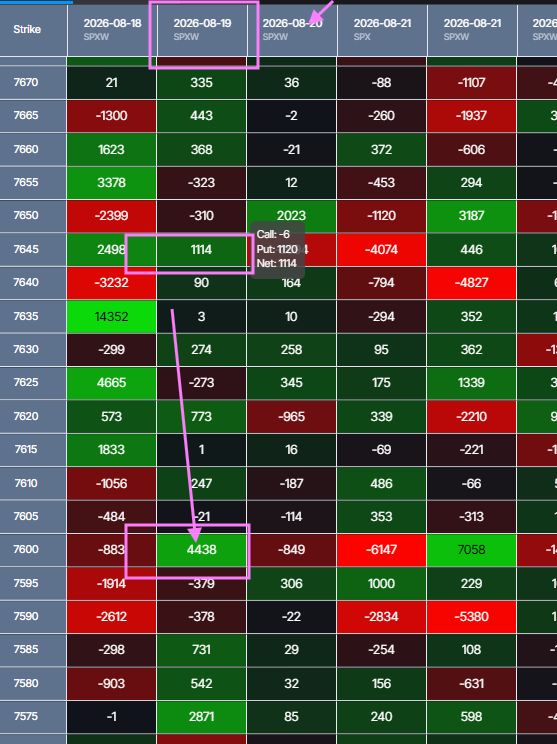
Across expirations, the heavier positioning gradually slopes lower. That does not make 7620 a forecast, but it does reinforce the larger working read:

Through month end, the book leans lower.

For today, though, we trade today.

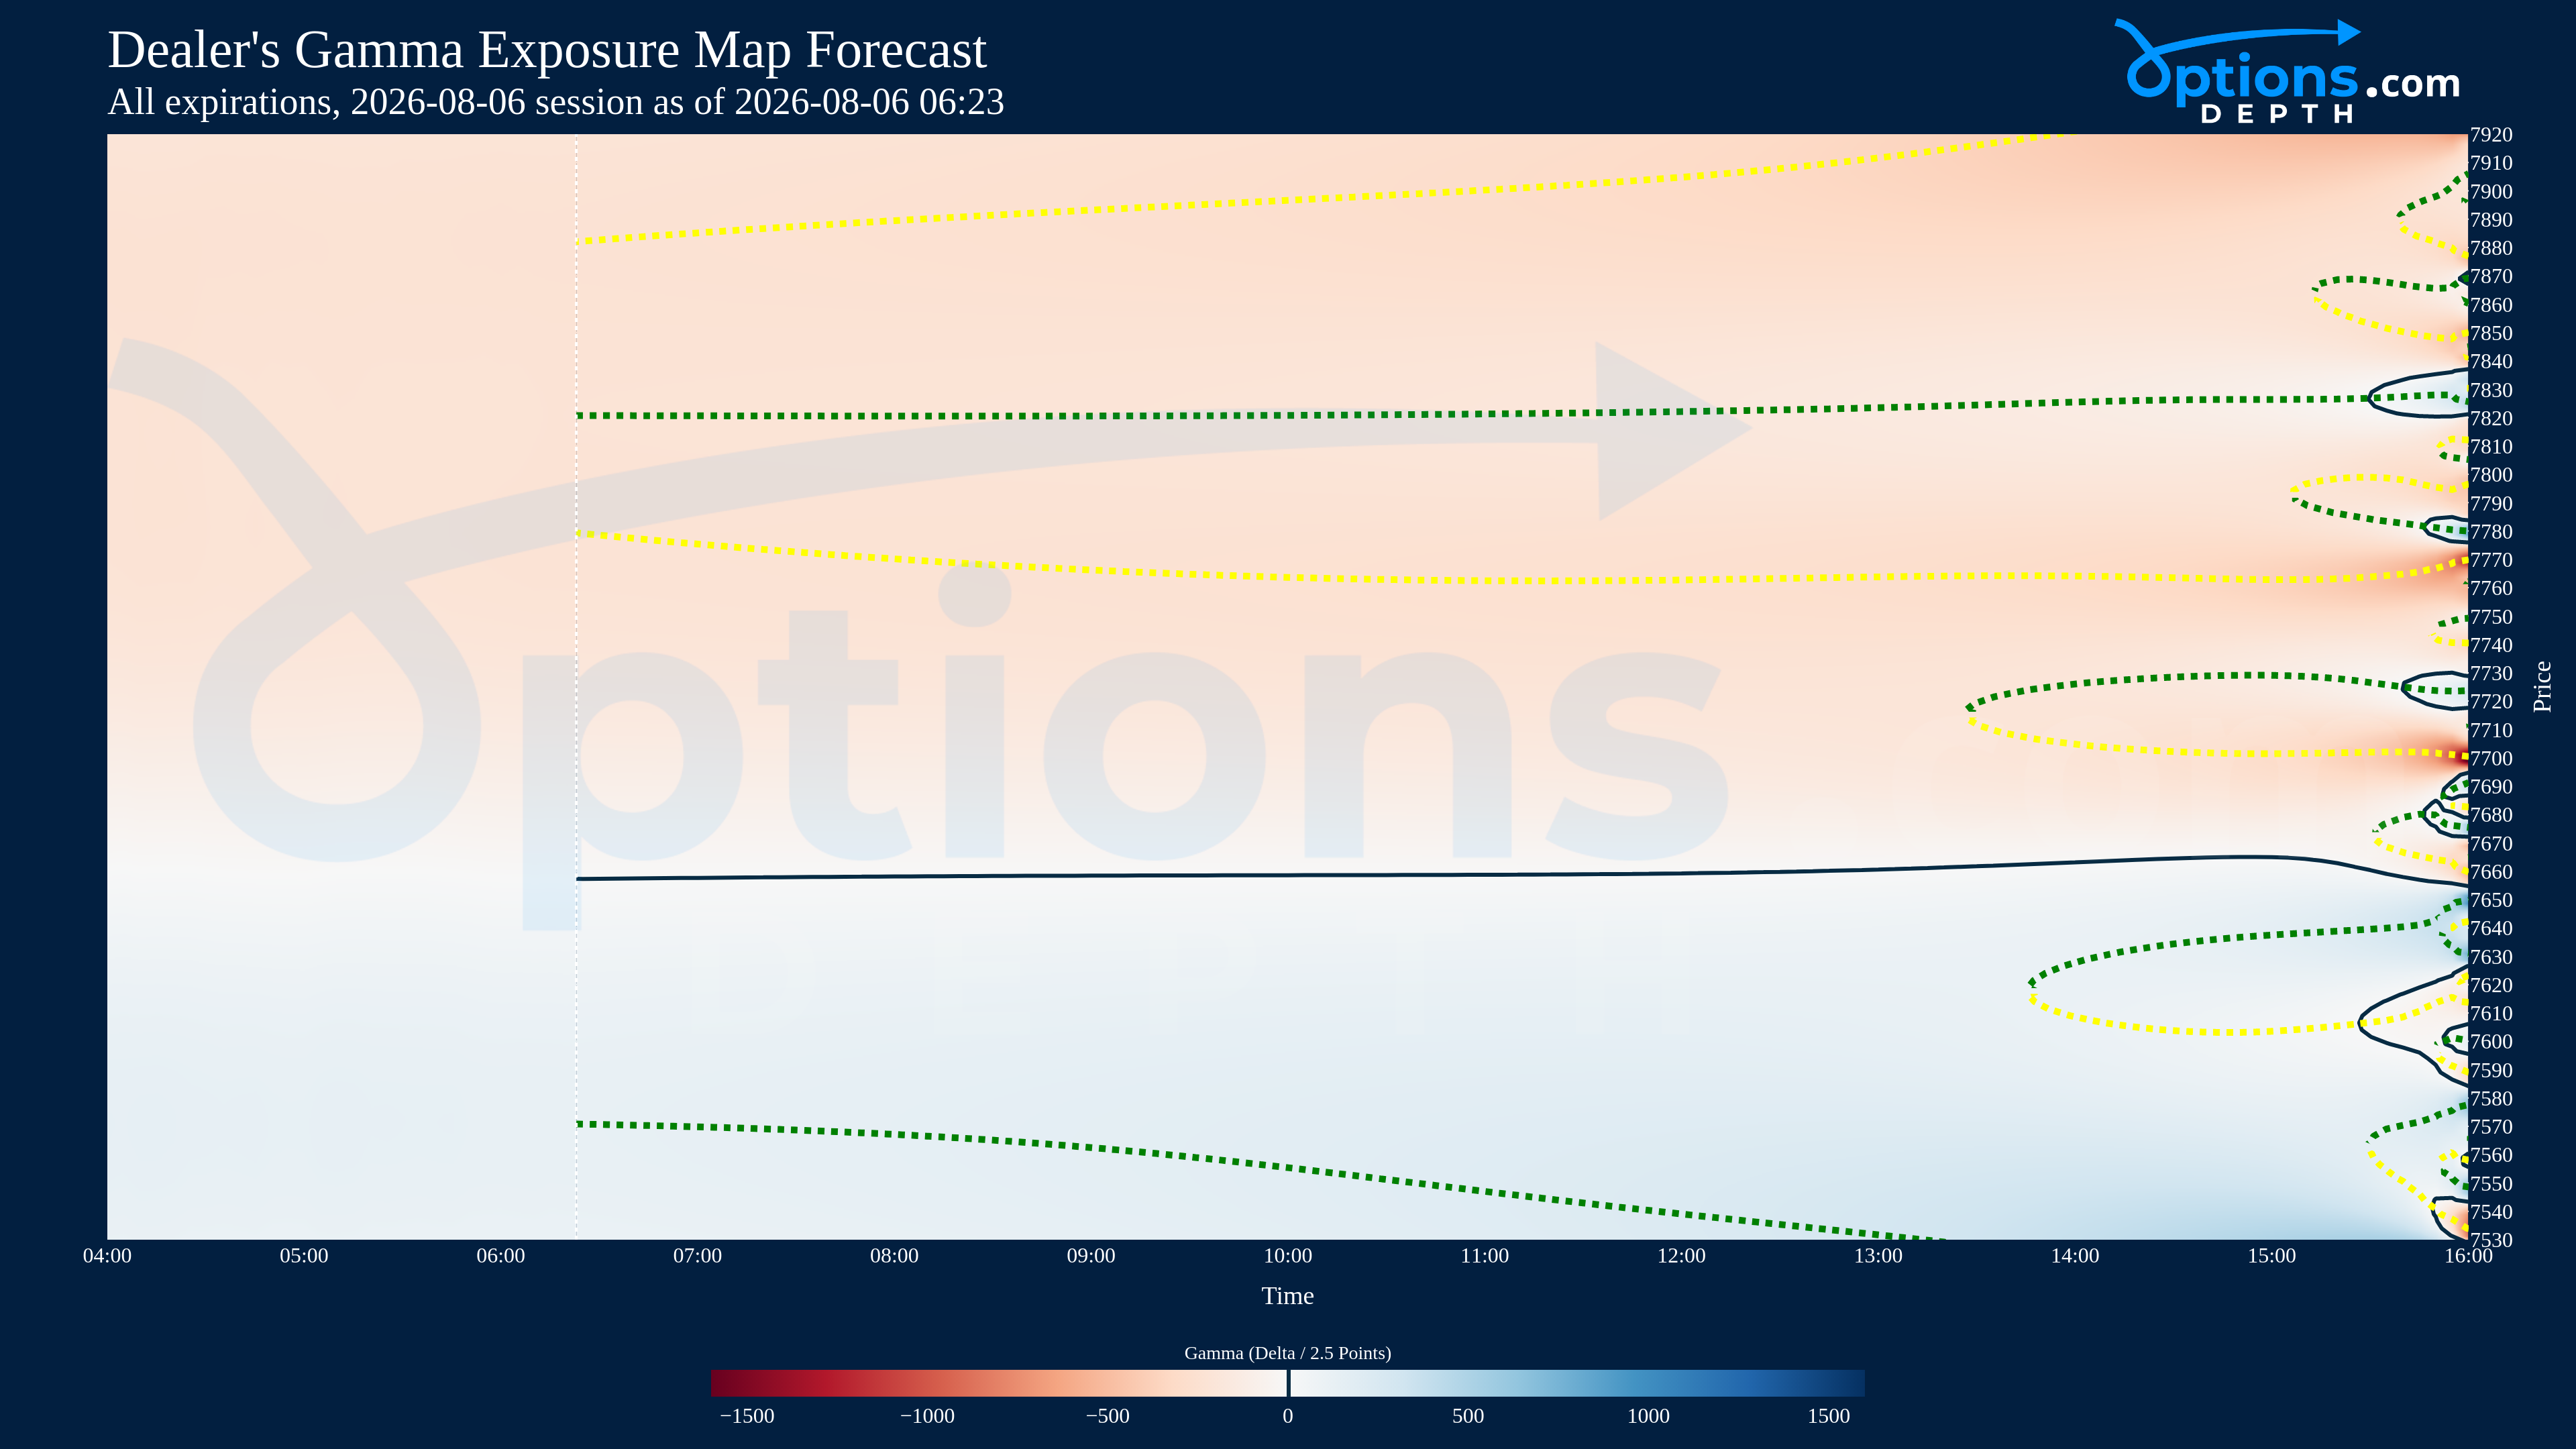
The immediate question is whether SPX repairs 7700 and starts working toward the positive-gamma structure overhead — or rolls back through the overnight low and lets the lower charm path take over.

🗓️ EVENTS & EARNINGS

TUESDAY NIGHT READ-THROUGH

$KEYS traded lower despite a beat — more of an expectations-were-high signal for semiconductor, communications and AI-networking test equipment than a demand-collapse read.

$JKHY positive — bank-tech spending remains steady.

$TOL roughly flat — housing is holding up rather than rolling over.

WEDNESDAY 8/19

AM — VIX monthly settlement

BTO — $TGT · $LOW · $TJX · $EL · $ADI · $VIK

Four useful consumer/housing/discretionary reads land alongside $ADI for semis.

That gives us a pretty good cross-section of consumer, housing/remodeling, value/discretionary and semiconductor demand on the same morning the August VIX book settles.

2:00 ET — FOMC minutes

Inflation concerns are already in the tape. Crude is bid, the long end is near decade-plus extremes, and the 10-year is around 4.70%.

At 2:00, let the macro bros and their algos fight it out.

THURSDAY 8/20

8:30 ET — Initial Claims · Continuing Claims
BTO$WMT · $DE · $ROST · $BABA

FRIDAY 8/21

August OPEX

AHEAD

Wednesday 8/26 — PCE + $NVDA
Aug. 27–29 — Jackson Hole

📏 LEVELS & LINES — THE PLAYING FIELD

EXPECTED MOVE

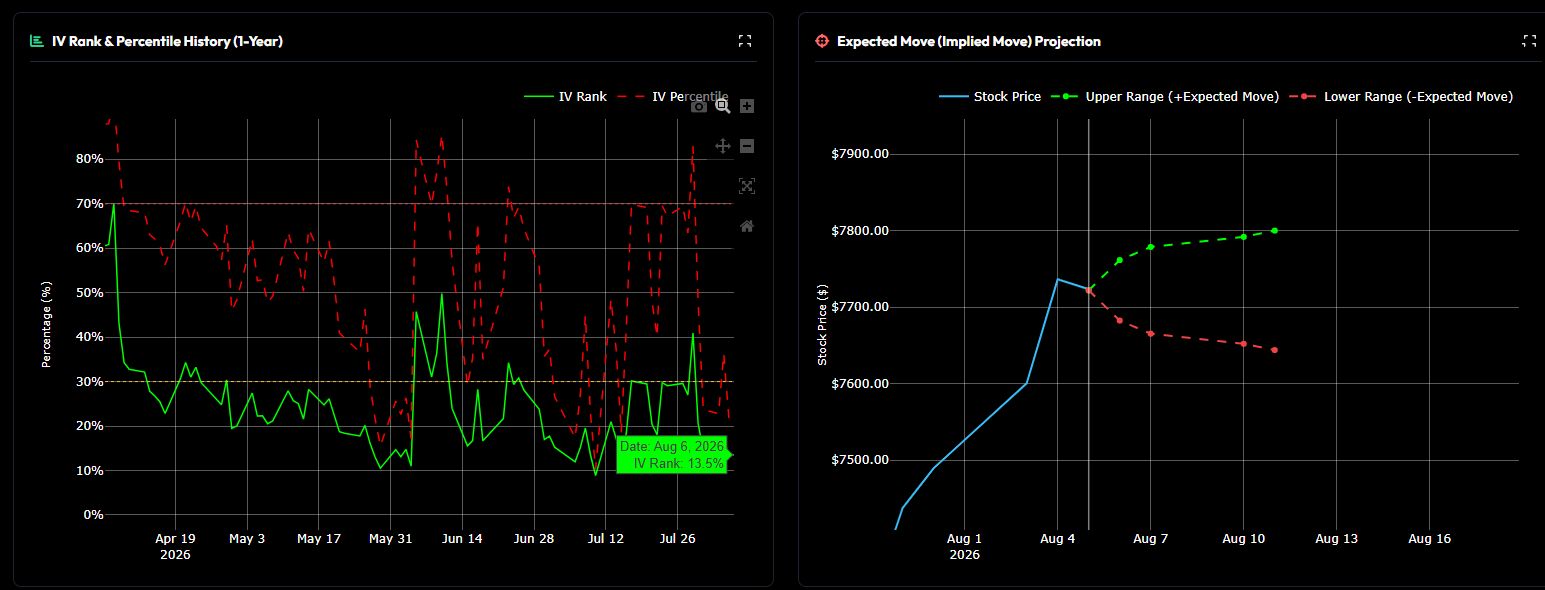
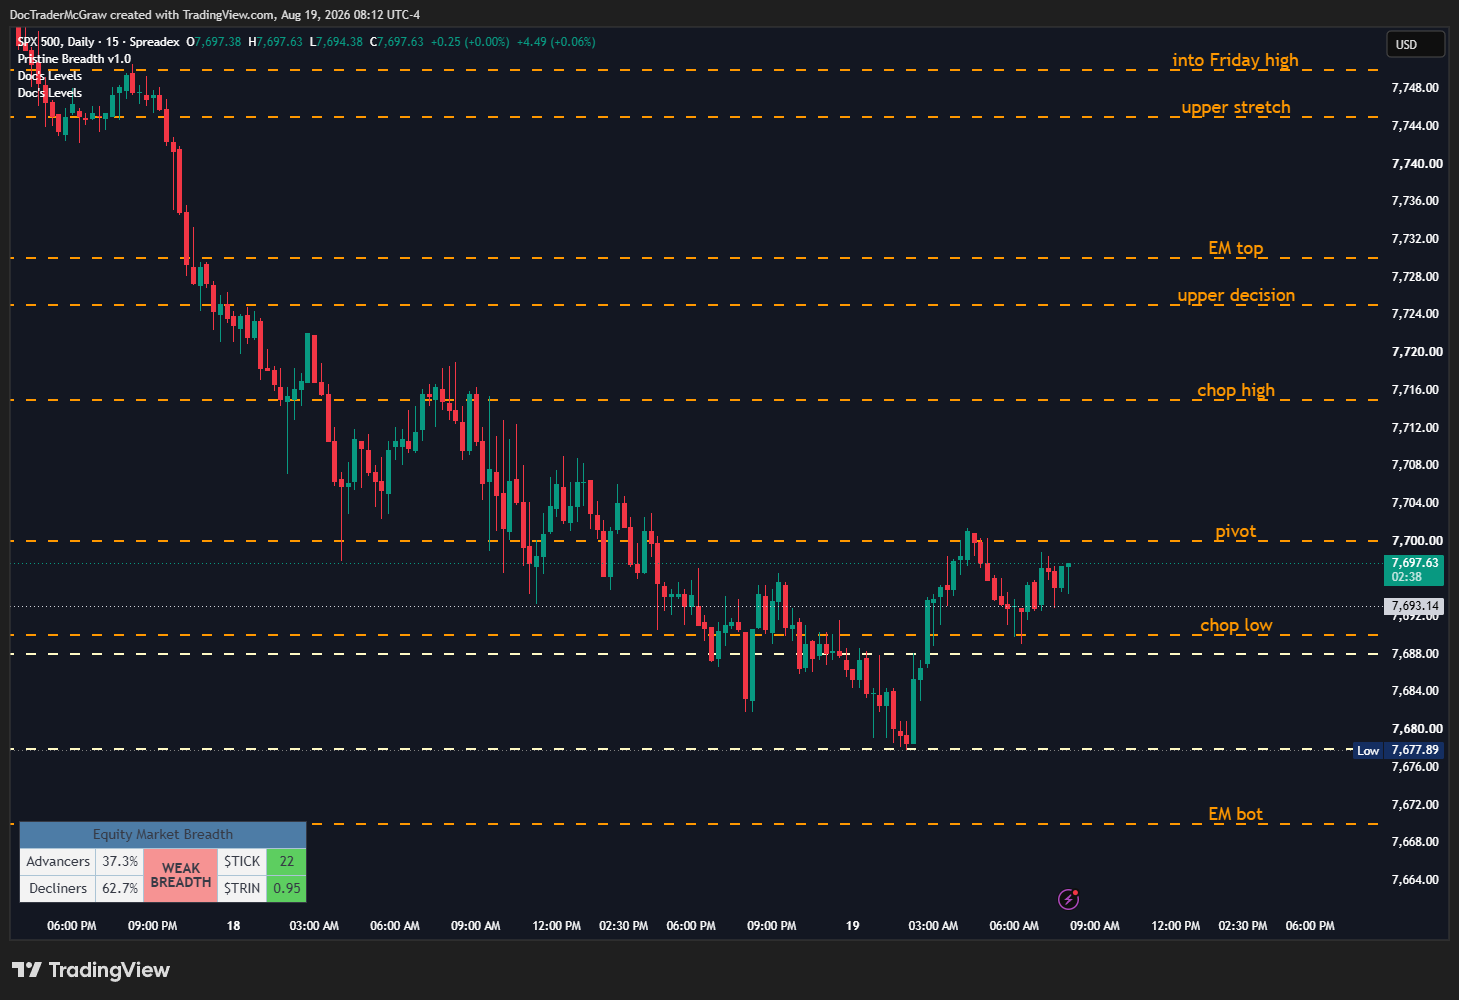
08/19/26: EM/Straddle: 28.80 (ref. SPX 7700) → 7670 <> 7730 Wednesday

1.5x EM → 7655 <> 7745

Overnight low — 7677.89

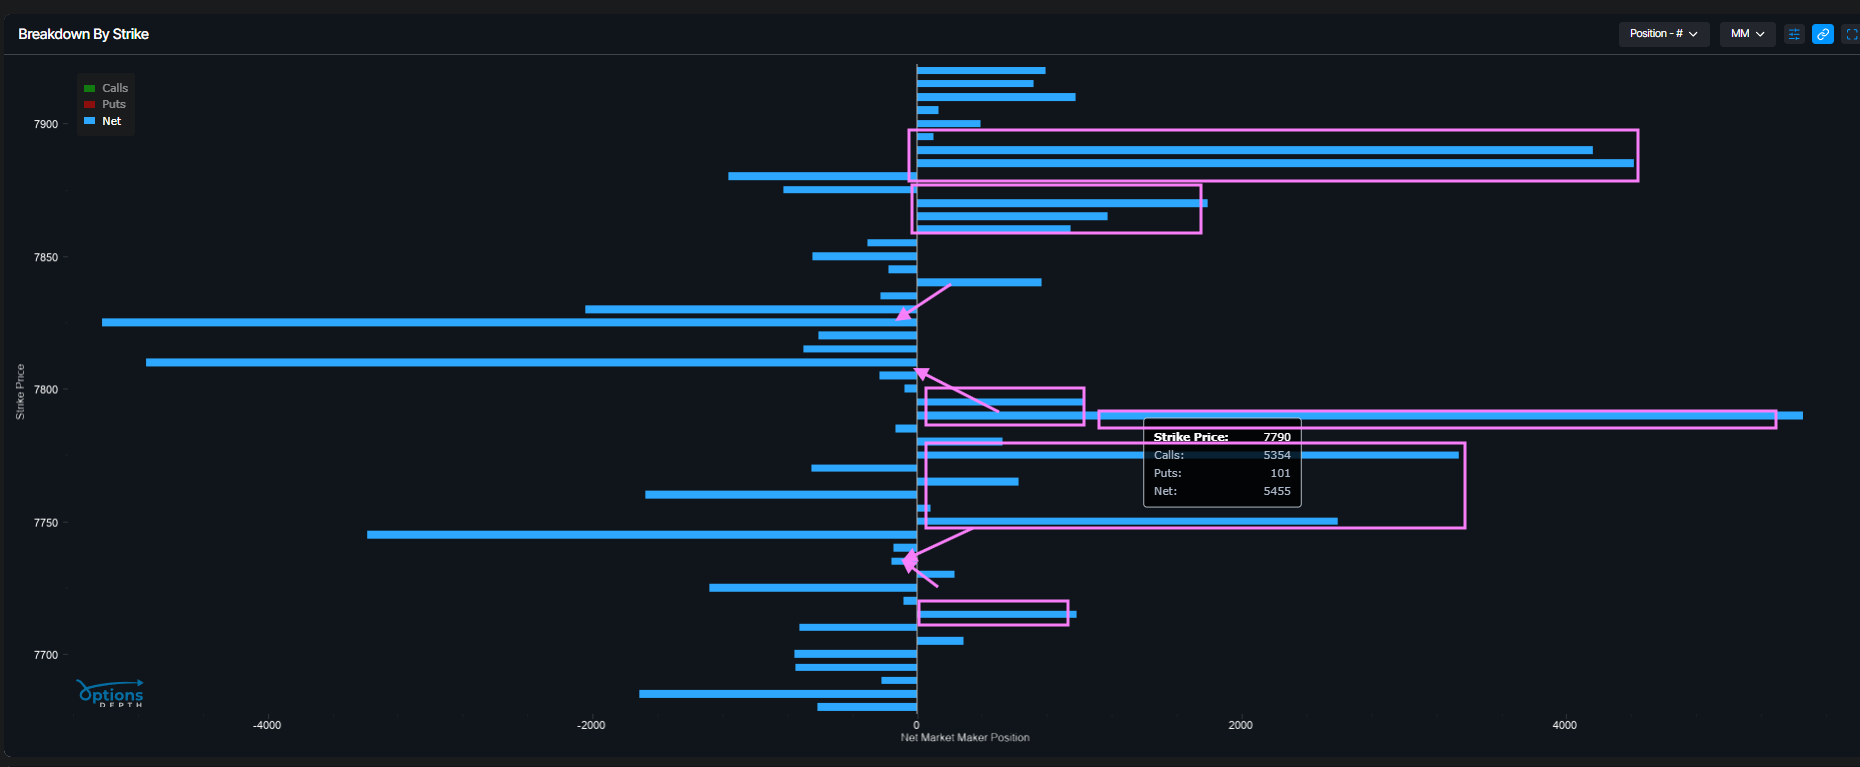
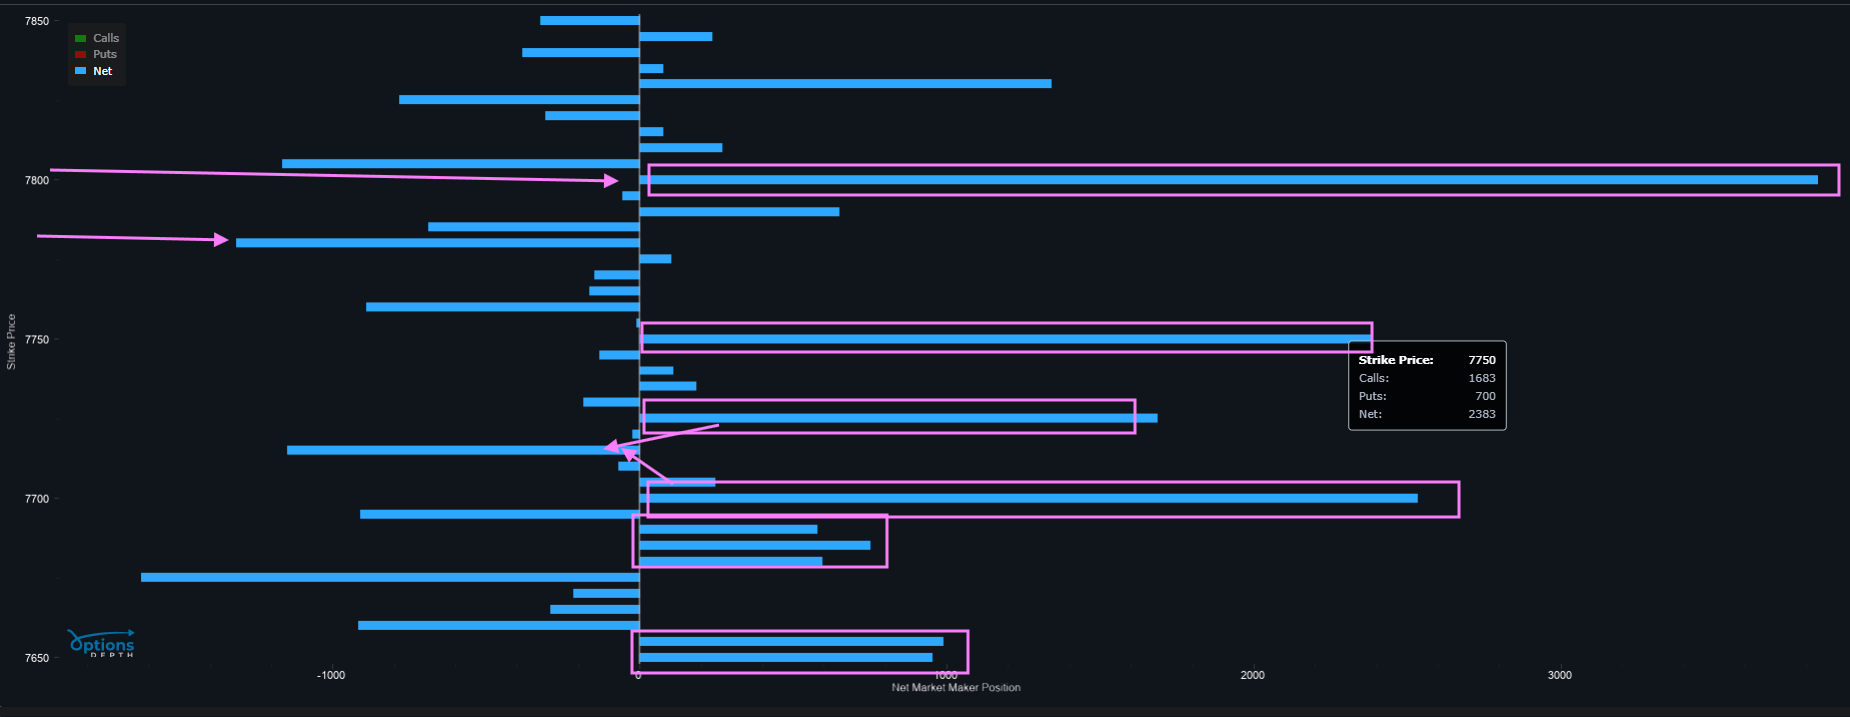
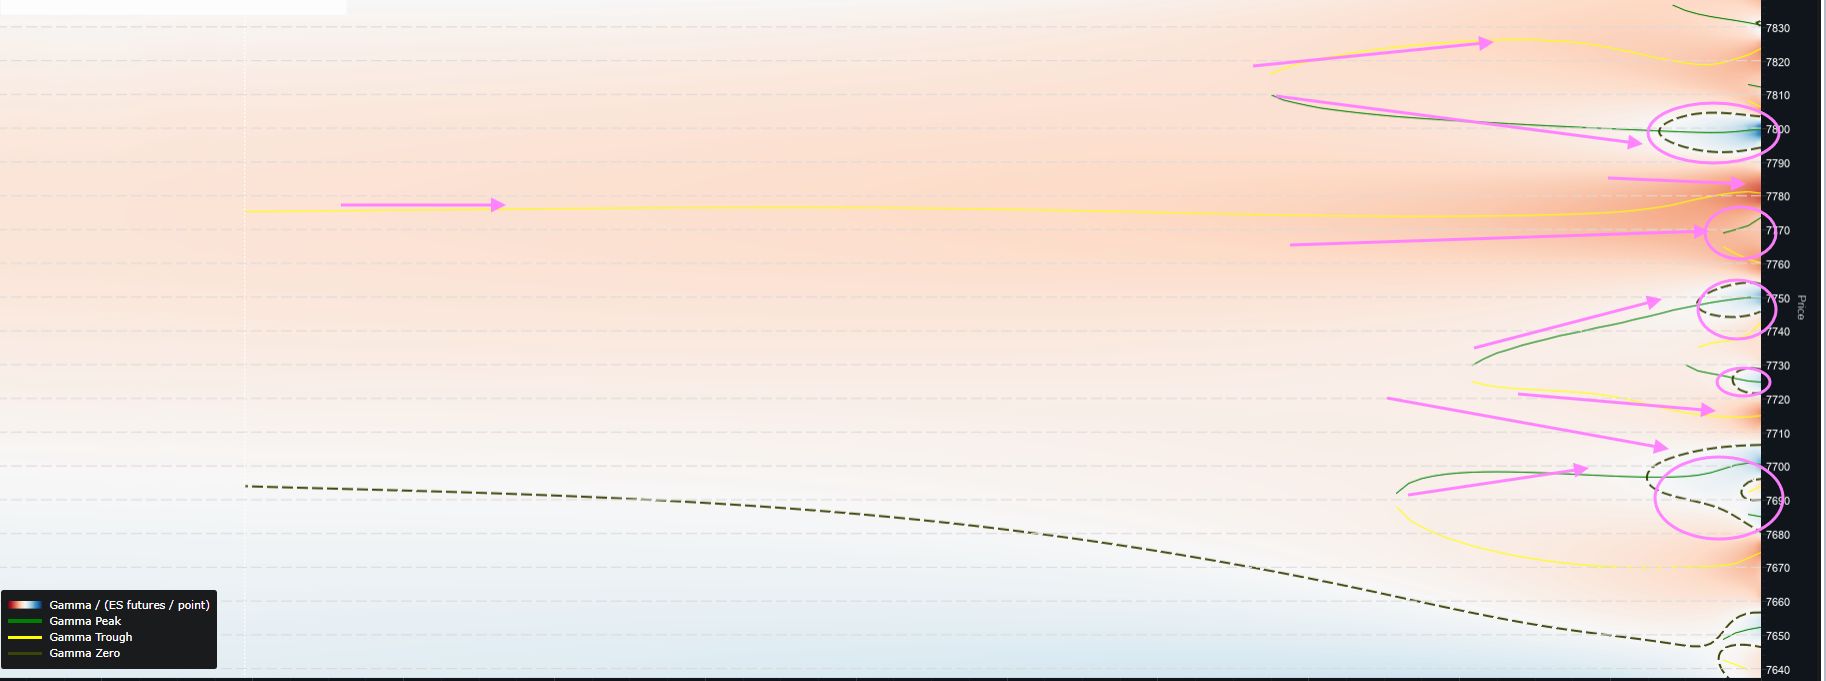
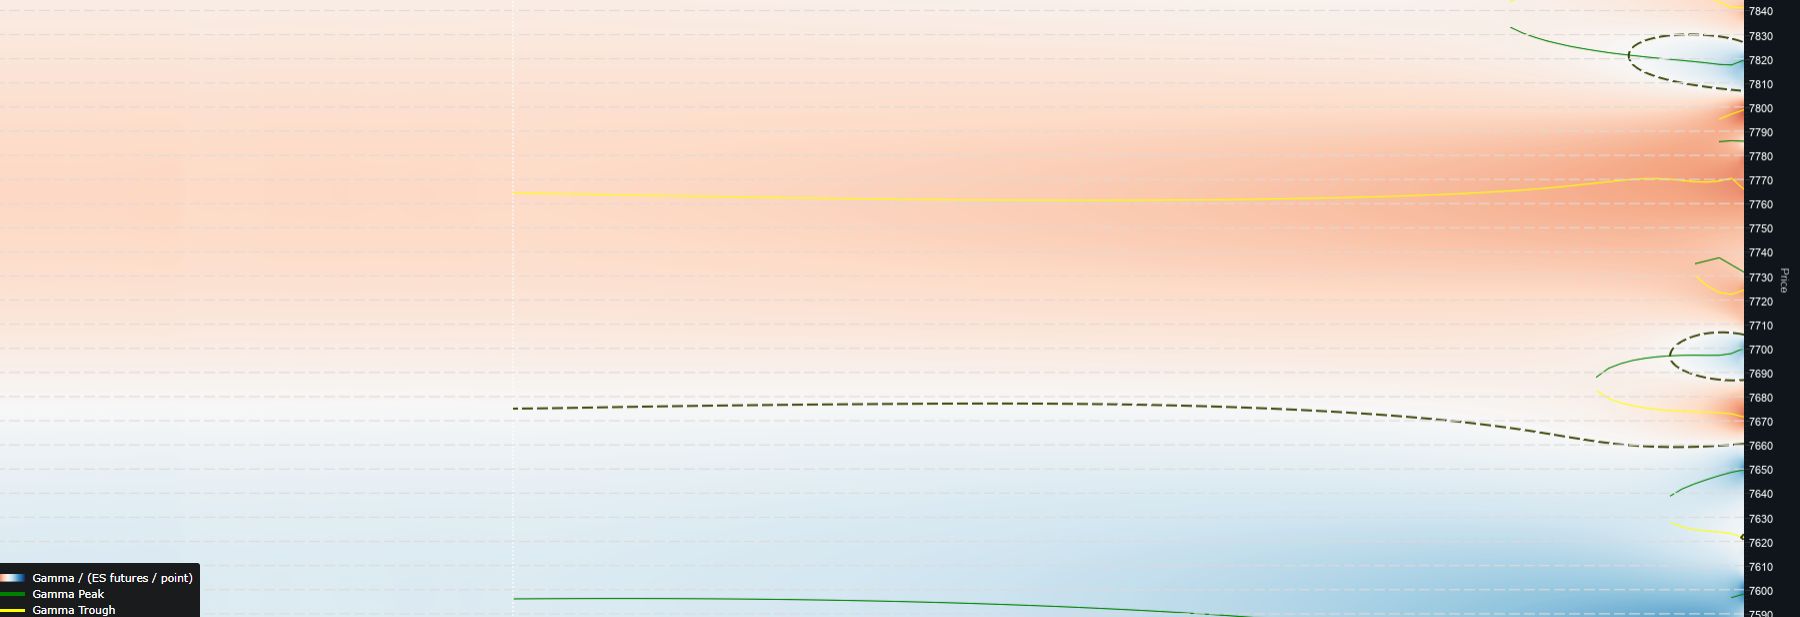
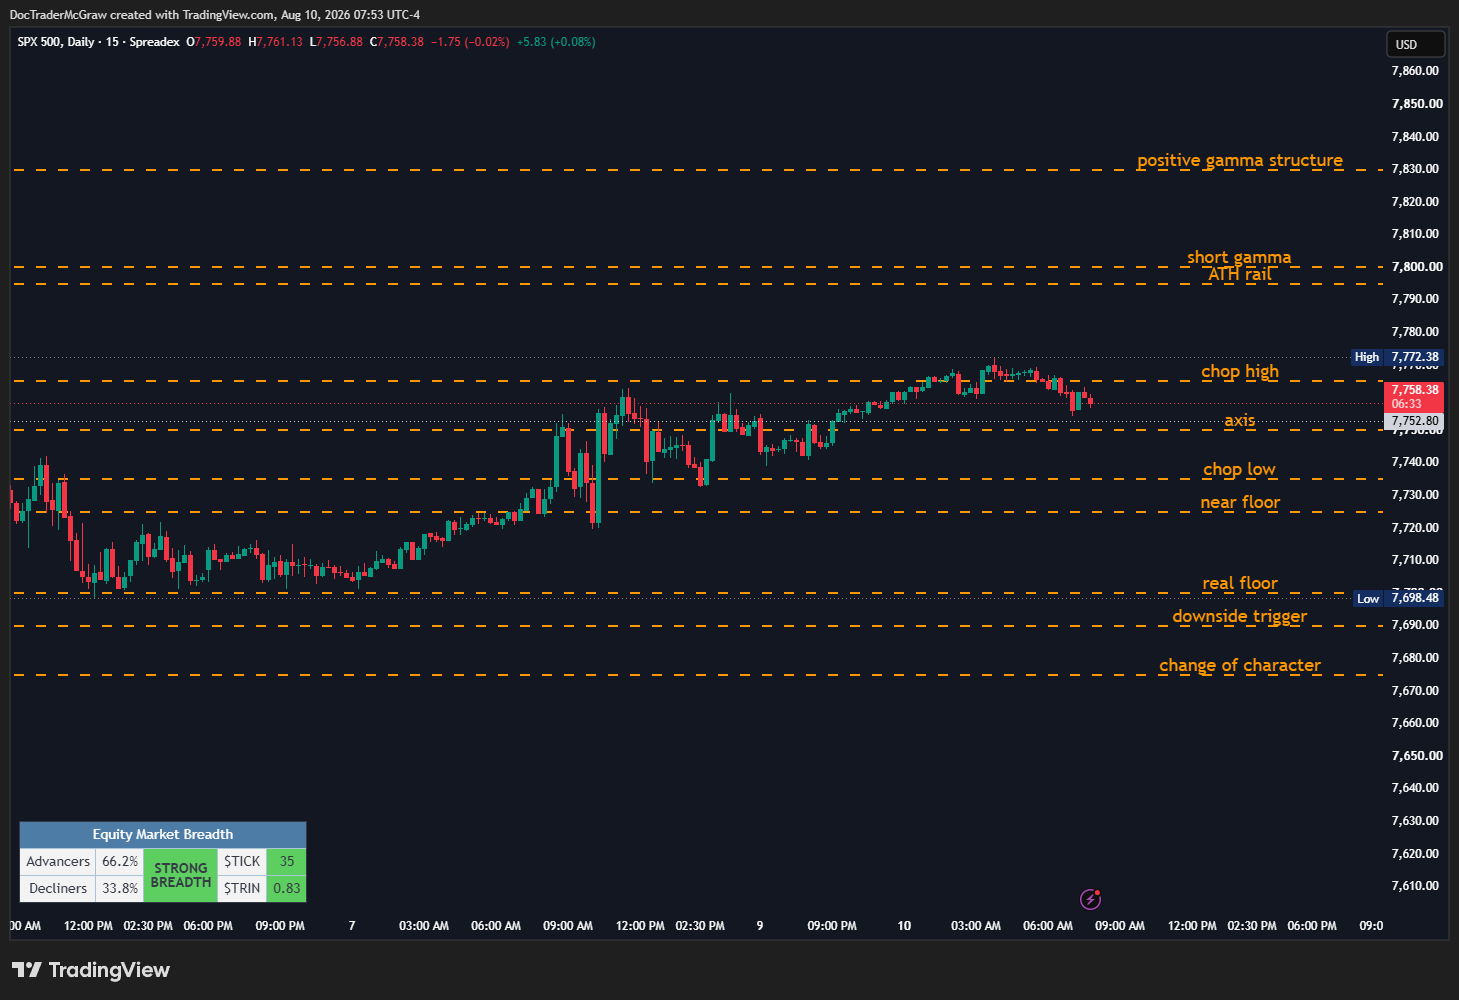
The straddle and the heat map line up reasonably well.

7725/7730 is the important upper neighborhood: positive gamma begins to build as price gets into that area and the upper EM rail lands in the same vicinity.

7670/7675 is the first important lower neighborhood: lower EM rail plus the downside charm path.

And if that fails, 7655/7650 is where the larger structure starts doing real work.

The important intraday frame is narrower:

7690–7715.

That is today’s working chop.

7700 sits in the middle as the natural pivot and can itself get sticky.

7715 is the upper edge and begins bringing price into the orbit of the larger positive-gamma region above. Depending on time of day, volatility and positioning that develops during the session, price can stall or get sticky there before ever reaching 7725.

🐐 The free section gives you the playing field. Below the paywall: today’s two-sided charm path, the full Road Map, the wider MOPEX structure, premium framework, TradingView strings and Cheat Card.

Subscribe for the full Daily Plan:

🌡️ VOLATILITY & POSITIONING

VIX SETTLEMENT

The August VIX book settles this morning.

The old front-month /VX went out around 15.75.

The new front month starts near 18.

That is the reference now.

Over the next several sessions, whether that premium remains firm or begins bleeding out becomes part of the post-settlement read.

Today, I care more about the behavior than the number itself.

If SPX repairs while the new front-month premium softens, the market is absorbing the transition cleanly.

If SPX struggles while the new front month stays firm or builds premium, that is different information.

TWO-SIDED CHARM PATH

Today’s positioning gives us plausible decay paths in both directions.

Upside: reclaim 7700 → 7710/7715 → 7725/7730.

Downside: lose 7690/7685 → 7675/7670 → 7655/7650.

The straddle rails land almost exactly where those paths become more interesting.

That does not mean price has to travel to either rail.

It means the pricing and the structure are pointing us toward the same decision areas.

BIGGER BOOK

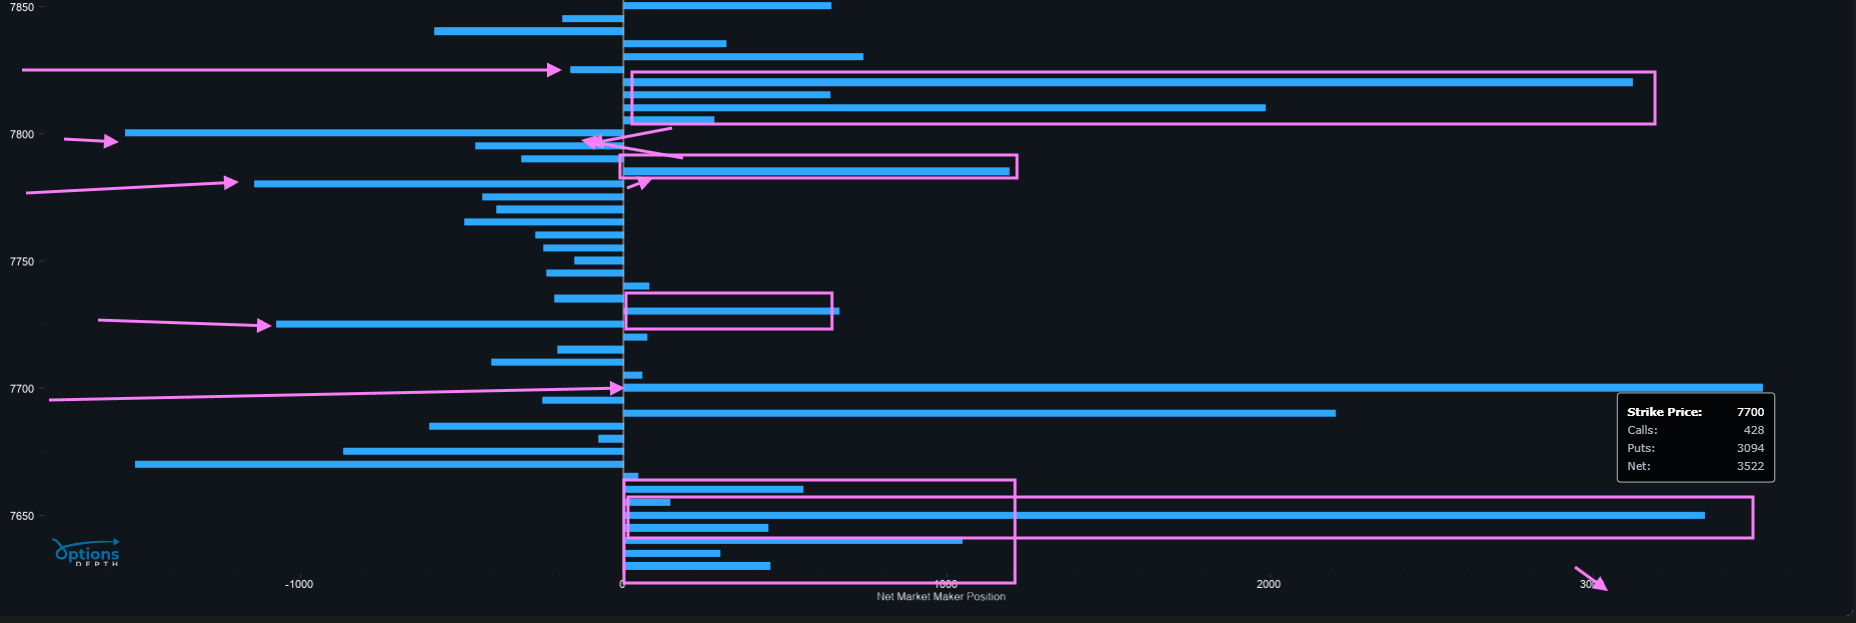
Across expirations, the larger positioning concentrations step progressively lower.

That is why 7650 matters beyond a single session and why 7620, the June highs, remains on the bigger map.

Again, not today’s prediction.

It is the structure waiting underneath if the current range continues migrating lower through and after OPEX.

What would challenge that larger lower lean: SPX accepting back above 7725 and holding it.

🎯 LEVELS & LINES — TERRAIN

🔭 7780 — into-Friday upper reference; back toward last week’s structure

🔭 7750 — into-Friday high / wider upside reference

📏 7745 — 1.5x EM upper stretch

📏 7730 — EM top

📦 7725 — upper decision; meaningful positive-gamma concentration

7715 — upper chop edge; sticky/stall potential as price enters the positive-gamma orbit

🧭 7700 — internal pivot; natural control area and capable of becoming sticky

⚠️ 7690 — lower chop edge; below here price turns red on the day and continuation becomes the cleaner read

🧱 7675/7670 — downside decision; overnight-low neighborhood plus EM bot / charm path

📏 7655 — 1.5x lower stretch

📦 7650 — into-Friday low; larger structural shelf

🏔️ 7620 — June highs; wider month-end downside reference

TODAY’S PATH

Upside: 7700 → 7715 → 7725/7730 → 7745/7750 → 7780

Downside: 7690 → 7675/7670 → 7655/7650 → 7620

🗺️ SPX ROAD MAP 0DTE

CHOP ZONE — 7690 TO 7715

This is deliberately tighter than the expected move.

It is built around Tuesday’s range, today’s gamma structure and the natural 7700 pivot.

Price can move inside and outside this zone without every excursion becoming a breakout. What matters is whether it can stay displaced from an edge.

WITHIN CHOP

IF price holds/reclaims 7700 → the stronger half of the range opens toward 7710/7715.

IF 7700 keeps rejecting → price remains in the weaker half of chop, with 7690 back in play.

IF price reaches 7715 and stalls → that is consistent with price entering the positive-gamma orbit above. Rotation back toward 7700 is normal.

The later in the session we get, the more decay and positioning can make that upper area sticky if volatility remains contained.

ABOVE CHOP — 7715 UP

IF price accepts above 7715 → 7725/7730 becomes the next real decision.

That is where positive gamma and the upper EM rail converge.

IF 7725/7730 accepts → the repair becomes more meaningful and 7745/7750 comes into play.

Beyond that, 7780 is the wider into-Friday reference.

Acceptance above 7725 also starts challenging the broader lower lean we have been carrying into month end.

Do not treat a wick through a level as acceptance.

BELOW CHOP — 7690 DOWN

IF price accepts below 7690 → price is red on the day and the downside path opens toward 7675/7670.

IF 7675/7670 holds → that is the first place where pricing and the charm path say a reaction should be respected.

IF 7670 gives → 7655/7650 becomes the larger structural conversation.

That is where more meaningful dealer-long positioning should begin producing stabilizing hedging flow on the approach.

As always, volatility gets a vote.

Front-end vol contained → the cushion has more room to work.

Vol expanding hard → price can run through structure that otherwise should dampen it.

IF 7650 fails with acceptance → the June highs near 7620 move from background reference toward the active map.

💰 PREMIUM SELLERS

Today’s straddle is roughly 28.80, giving us 7670 <> 7730.

The important thing is that both rails have structural company.

7730 sits beside the larger positive-gamma region above.

7670 sits beside the lower charm path.

That makes the rails useful decision areas, but not automatic premium-sale buttons.

For the wider Friday-to-Friday frame, 7650/7655 and 7750–7780 remain the more useful outer references as we move toward OPEX.

My modified outer bands are still where I am more interested in structuring Friday-to-Friday credit spreads and iron condors.

And the same rule applies:

Do not sell a level simply because price reached it.

The route into the level, volatility behavior and whether price rejects or accepts still matter.

🎯 BOTTOM LINE

Wednesday starts with a cleaner decision tree than Tuesday.

SPX washed down to 7677.89 overnight and bounced.

Now 7700 is the pivot.

7690–7715 is the working chop zone.

Above 7715, price starts entering the positive-gamma structure and 7725/7730 becomes the real repair test.

Below 7690, 7675/7670 becomes the first continuation area.

Lose that and 7655/7650 is where the larger structure waits.

Meanwhile, VIX settlement changes the volatility book this morning, FOMC minutes arrive at 2:00, and Friday still clears the equity-options structure.

The larger book continues to lean lower into month end.

But we do not trade the month-end thesis at 9:31.

We trade what price confirms today.

Gotta WATCH the FLOW to be in the KNOW. 🐐

📊 TRADINGVIEW STRINGS

MAIN

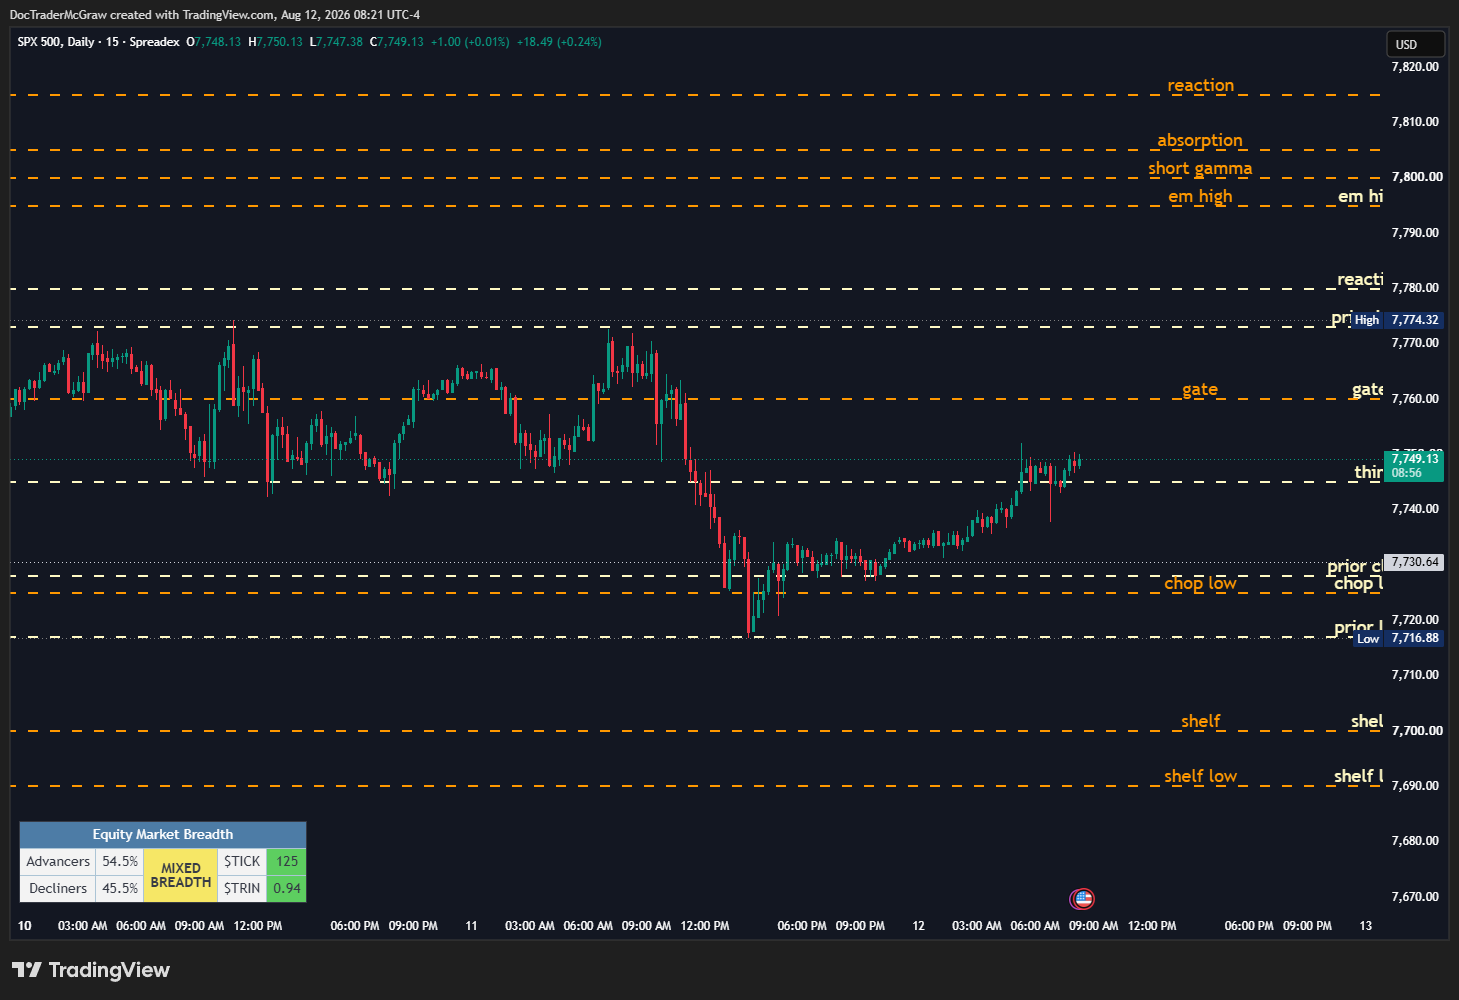
$SPX: June high, 7620, into Friday low, 7650, lower stretch, 7655, EM bot, 7670, chop low, 7690, pivot, 7700, chop high, 7715, upper decision, 7725, EM top, 7730, upper stretch, 7745, into Friday high, 7750, Friday stretch, 7780

$ES1!: June high, 7637, into Friday low, 7667, lower stretch, 7672, EM bot, 7687, chop low, 7707, pivot, 7717, chop high, 7732, upper decision, 7742, EM top, 7747, upper stretch, 7762, into Friday high, 7767, Friday stretch, 7797

$SPY: June high, 760, into Friday low, 763, lower stretch, 763.5, EM bot, 765, chop low, 767, pivot, 768, chop high, 769.5, upper decision, 770.5, EM top, 771, upper stretch, 772.5, into Friday high, 773, Friday stretch, 776

SCALPER

$SPX: overnight low, 7678, prior low, 7688, chop low, 7690, pivot, 7700, prior high, 7715, upper decision, 7725, EM top, 7730

$ES1!: overnight low, 7695, prior low, 7705, chop low, 7707, pivot, 7717, prior high, 7732, upper decision, 7742, EM top, 7747

$SPY: overnight low, 765.8, prior low, 766.8, chop low, 767, pivot, 768, prior high, 769.5, upper decision, 770.5, EM top, 771

ES built on the 17-point basis carried forward from the current setup.

🐐 CHEAT CARD

📍 Spot ~7700 · Straddle 28.80 · Rails 7670 <> 7730

🌀 Chop 7690–7715

🎯 7700 — pivot / control · can get sticky

⬆️ Above 7715 → 7725/7730 → 7745/7750 → 7780

⬇️ Below 7690 → 7675/7670 → 7655/7650 → 7620

📦 7715 — upper sticky/stall edge

7725/7730 — positive gamma + EM top · real upside repair decision

🧱 7675/7670 — first downside continuation decision

🏔️ 7650/7655 — larger structural shelf

🌡️ VIXpery — settlement AM · new /VX front month near 18

📅 Today$TGT · $LOW · $TJX · $EL · $ADI BTO · FOMC minutes 2:00 ET

📦 Friday — August OPEX

🔭 Month-end read — book leans lower while below 7725; June highs near 7620 become more relevant if that structure persists after OPEX

🎯 The read — 7700 decides repair versus continuation; trade the confirmation, not the thesis

🔁 If this work helps you during the trading day, share or restack it.

📺 Join me live at 8:30 AM ET:
YouTube Live
X/Twitter Live

QUANTUITION — Analytics + Edge from Experience. 🐐
file_UqMW8vyLMWV2P
file_XO5Dv8rZ6D9N0
file_Ra1ALiI4WW5rW
file_HXov2C4rrIjp6
Profile picture
Doc McGrawProfile picture@doctradermcgraw·2d

Doc’s SPX Market Report — Daily Plan — Tuesday, August 18, 2026 — SPX Tests 7700 as VIXpery Moves Onto the Clock

Monday delivered nearly 2x its priced move, the overnight session tested 7700, and Tuesday starts with a thinner book as the August VIX structure heads into settlement.

🔴 LIVE — 8:30 AM ET

YouTube Live
X/Twitter Live

👀 ABOVE THE FOLD

• Monday went nearly 2x the straddle to the downside — priced ~24 points, ran ~46, and closed below the lower rail
• Overnight SPX tagged 7697.88 and bounced — the first look at the area where pricing and positioning begin to line up
VIX printed 16.09 and backed off — still low absolute vol, but Monday put a real bid into the front end
VIX9D +16.78% vs. VIX +6.80% Monday — downside protection repriced, though from a very low base
• The long end remains the macro pressure point, while VIX settlement comes Wednesday morning and August OPEX follows Friday

🔁 If the Daily Plan helps you see the market more clearly, share or restack it. Someone else may be looking at the same tape and missing the plumbing underneath it.

🧭 CONTEXT

Monday closed 7745.05, −0.52% — opened near the high, closed near the low, and never mounted much of a bounce. Breadth was weak at roughly 33% advancers.

The tell was the way the selling happened.

XLP −1.64% and XRT −1.59% sold with the broader market while GDX +2.13%, SLV +1.86%, and XLE +1.08% held up.

Inside tech, software took the hit while semis held:

IGV −2.01% · MSFT −3.04% · META −3.44% · SMH +1.08%

That is not the clean signature of a growth scare. It looks much more like a rates / term-premium move, with money favoring areas that can hold up better when the discount rate rises.

Crude added another layer. Iran headlines kept geopolitical risk premium in energy, /CL ran roughly 3%, and the long end remained under pressure. The 2-year barely moved by comparison.

That split matters.

When the front end sits relatively still while the long end sells off, the market is not primarily repricing the next Fed meeting. It is demanding more compensation to own duration.

There are two plausible pieces underneath that move: heavy supply/deficit pressure on one side and a less certain inflation path on the other. Both can be true.

Overnight extended Monday’s move. SPX traded down to 7697.88 before recovering into the 7710s, putting in roughly 45 points of range before the cash open — already more than today’s straddle prices for the entire session.

🗓️ EVENTS & EARNINGS

Tuesday 8/18

8:30 ET — Housing Starts · Import Prices
9:15 ET — Industrial Production
10:00 ET — Pending Home Sales

BTO$HD · $BIDU
ATC$KEYS

$HD gives us another housing/consumer read after Friday’s Retail Sales and U. Michigan sentiment miss.

$KEYS is worth watching closely after the close. It is not a pure semiconductor company, but it is a useful read-through on test-and-measurement, semiconductor capex, AI/data-center networking and broader technology demand.

Wednesday 8/19

VIX monthly expiration — AM settlement
2:00 ET — FOMC minutes
BTO$LOW · $TGT · $ADI · $TJX · $VIK

Thursday 8/20

8:30 ET — Initial Claims · Continuing Claims
BTO$WMT · $DE · $ROST · $BABA

Friday 8/21

August OPEX

Ahead: Wednesday 8/26 — PCE + $NVDA · Aug. 27–29 — Jackson Hole

Tuesday has enough on the calendar to create some opening noise around housing, inflation, growth and the consumer, but the larger weekly story remains structural.

📏 LEVELS & LINES — THE PLAYING FIELD

Expected Move

08/18/26: EM/Straddle: 26.75 (ref. SPX 7720) → 7690 <> 7750 Tuesday

08/21/26: EM/Straddle: 60.90 (ref. SPX 7720) → 7655 <> 7785 MOPEX AM

Prior session — high 7790.68 · low 7744.88 · close 7745.05

Overnight — low 7697.88

Week 8/10–8/14 — high 7816.70 · low ~7739

TA Reference

7816.70 — intraday all-time high, Aug. 13

7700–7800 — broader consolidation area; price is now testing its lower end

7620 — June all-time high, former resistance taken out

7600 — unfilled gap

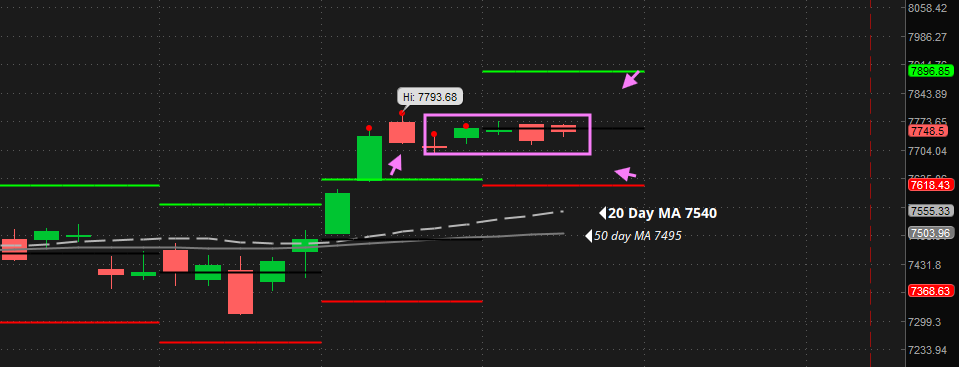
20-day MA ~7555 · 50-day MA ~7505

One reference stands out for later in the week:

Friday’s 7655 lower rail sits almost directly on top of the heaviest structural concentration below the market and just above the 7620 former high.

Pricing and positioning are beginning to agree in the same neighborhood.

The free read is simpler:

The heaviest structure sits below spot. Between price and that deeper shelf, most of what we have are catches — not floors.

🐐 The playing field is above. Below the paywall: the full terrain, today’s Road Map, VIXpery mechanics, premium-selling framework, TradingView strings and Cheat Card.

Subscribe for the full Daily Plan:

🌡️ VOLATILITY & POSITIONING

Monday close: VIX 15.19 (+6.80%) · VIX9D 12.39 (+16.78%) · VVIX 93.92 (+7%) · /VX 15.60

Pre-market: VIX ~15.85 · overnight high 16.09 · /VX ~15.90

The percentage changes look dramatic.

The absolute level does not.

VIX at 15–16 is still low volatility.

What changed Monday was the surface.

The decomposition showed put skew as the largest contributor to the VIX move. Call skew was negative for a second straight session, and roughly two-thirds of the VIX increase came from surface repricing rather than the mechanical effect of SPX simply moving lower.

Downside got bid.

Upside demand faded.

But there is another wrinkle.

Both VIX and VIX9D topped around midday Monday and faded while SPX continued sliding into the close. That suggests at least some of the put demand may have been position-related covering rather than a persistent rush for new protection.

So we had a real put bid — but it did not keep building all afternoon.

That matters today.

16 IS STILL THE FIRST VOL DECISION

VIX printed 16.09 overnight and came back.

The current strike structure runs roughly 16 through 17.5, with 16 the first meaningful concentration.

An overnight poke above 16 is not acceptance.

Working materially through that cluster would require something more than what we have seen so far.

VIXPERY

Tuesday is the last full session with the current August VIX structure doing the work.

Settlement is Wednesday morning off the opening prints.

After settlement, the current book does not magically “release” the market. The next book takes over.

What changes is that the specific positioning that has been shaping VIX in the 15–16 neighborhood is no longer the same positioning doing the work.

That leaves Wednesday–Thursday between VIX settlement and Friday OPEX as an interesting transition window.

TODAY’S VOL TELL

VIX9D holds firm → some of Monday’s downside bid is being carried into the back half of the week.

VIX9D gives it back → Monday’s surface repricing was at least partly temporary.

🎯 LEVELS & LINES — TERRAIN

📦 7790/7780 — upper ladder. Back into the area where price spent much of last week

7760 — reaction

📏 7750 — EM top. First real overhead decision

⚠️ 7725 — contested

🧭 7720 — current reference area

📦 7710 — cleaner nearby long inventory; first catch

📦 7700 — held overnight. Positive positioning remains, but appears lighter than Monday’s close depending on the platform. Do not assume the overnight reaction automatically repeats

📏 7690 — EM bot

7685 — thin transition. Not much here to absorb price

🧱 7650 — dominant lower structure. Largest nearby position by a wide margin, with Friday’s 7655 rail essentially sitting on top of it

TODAY’S PATH

Upside: 7720 → 7725 → 7750 → 7760 → 7780

Downside: 7720 → 7710 → 7700 → 7690 → 7685 → 7650

The structure is different from Monday.

The board is thinner around current price, and 7650 is where the real structural weight sits below.

That does not mean price is headed there.

It means that if the intermediate catches fail, there is not much structural muscle between here and the deeper shelf.

🗺️ SPX ROAD MAP 0DTE

CHOP ZONE — 7700 TO 7750

Spot begins inside the zone after bouncing from the overnight low.

The lower edge already produced one reaction overnight.

The upper edge is today’s expected-move rail, with Monday’s close sitting just underneath it.

Inside here, expect price to move inside and outside the zone without every excursion becoming a breakout. What matters is whether price can stay displaced from an edge and build acceptance.

IF price holds 7710 on a pullback → the first catch is doing its job. Rotation inside the broader 7700–7750 zone remains intact.

IF price pushes toward 7750 and stalls → the EM rail is doing what it should. Rotation back into the zone is normal behavior, not automatically bearish.

ABOVE CHOP — 7750 UP

IF price accepts above 7750 → price has cleared the EM top and moved back into last week’s range.

THEN 7760 is the first reaction, followed by the 7780 area.

Watch the front end with it.

Price up + VIX9D down would argue that Monday’s downside bid is being unwound.

Price up + front-end vol staying firm would be a different signal.

Do not treat a wick through 7750 as acceptance.

BELOW CHOP — 7700 DOWN

IF 7700 gives after already holding once overnight → do not assume the second trip is the same trade as the first.

The positioning there appears lighter than it did Monday, and repeat tests matter.

IF 7690/7685 gives → the EM bot is lost and the map gets much thinner.

There is relatively little structural weight between that area and 7650.

IF price begins approaching 7650 → this is where dealer-long positioning should begin generating more stabilizing hedging flow into the decline.

But the vol path gets a vote.

Front-end vol contained → the cushion has more room to work.

Front-end vol expanding sharply → the stabilizing effect can weaken or be overwhelmed.

And remember: reaction zone, not guaranteed floor.

💰 PREMIUM SELLERS

Tuesday’s straddle has already moved around.

It priced roughly 31.80 near the overnight low, then compressed to 26.75 as SPX recovered.

That tells you something about how quickly the market is changing its view of the bounce.

Monday’s 0DTE straddle was roughly 24 points.

The cash session delivered about 46.

Recent short-dated pricing has been running behind realized movement.

That is worth remembering before deciding today’s premium is automatically generous.

FRIDAY-TO-FRIDAY FRAME

Friday AM settlement is pricing roughly:

7655 <> 7785

The lower rail sits almost directly on the dominant 7650 structural shelf.

That alignment matters for the Friday-to-Friday premium framework.

My broader modified bands remain the areas I use when structuring credit spreads and iron condors, but the daily tape still decides how aggressively I want to lean on them.

Expiration is not a calendar permission slip to sell premium.

Structure, volatility and behavior still have to agree.

Size for the week you are in, not the one that just ended.

🎯 BOTTOM LINE

Monday pushed SPX out of last week’s range and put a bid into downside protection.

Overnight took price down to the 7700 area and produced the first reaction.

Tuesday now starts with a thinner book around spot.

7750 is the first meaningful overhead decision.

7700 is the first important lower test.

Below 7690/7685, the map thins toward the much larger 7650 shelf.

Meanwhile, VIX remains low in absolute terms even after Monday’s percentage jump.

The August VIX book settles Wednesday morning.

The equity-options book clears Friday.

Neither event guarantees movement.

But each changes which positioning is doing the work underneath the tape.

And the macro layer is not waiting around for either one: the long end remains under pressure, crude is carrying geopolitical premium, and the consumer gets several reads this week starting today.

Watch what holds. Watch what changes character. And do not confuse the first reaction with the final answer.

Gotta WATCH the FLOW to be in the KNOW. 🐐

📊 TRADINGVIEW STRINGS

MAIN

$SPX: real floor, 7650, thin, 7685, EM bot, 7690, catch, 7700, catch, 7710, contested, 7725, EM top, 7750, reaction, 7760, ladder, 7780

$ES1!: real floor, 7667, thin, 7702, EM bot, 7707, catch, 7717, catch, 7727, contested, 7742, EM top, 7767, reaction, 7777, ladder, 7797

$SPY: real floor, 763, thin, 766, EM bot, 767, catch, 768, catch, 769, contested, 770, EM top, 773, reaction, 774, ladder, 776

SCALPER

$SPX: overnight low, 7698, prior close, 7745, prior high, 7791, week high, 7817

$ES1!: overnight low, 7717, prior close, 7769, prior high, 7814, week high, 7838

$SPY: overnight low, 768, prior close, 773, prior high, 777, week high, 779

ES built on 17-point basis — ES 7734.50 against cash 7717.80.

🐐 CHEAT CARD

📍 Spot ~7720 · Straddle 26.75 · Rails 7690 <> 7750

🌀 Chop 7700–7750

⬆️ Above 7750 → 7760 → 7780

⬇️ Below 7700 → 7690/7685 → 7650

📦 7710 — first nearby catch

⚠️ 7700 — held overnight; repeat test matters

🧱 7650 — dominant lower structure · Friday lower rail 7655 sits on top

🌡️ VIX ~15.85 · printed 16.09 overnight · 16 remains first vol decision

📅 Today — Housing Starts / Import Prices 8:30 · Industrial Production 9:15 · Pending Home Sales 10:00 · $HD / $BIDU BTO · $KEYS ATC

Tomorrow — VIX settlement AM · FOMC minutes 2:00

📦 Friday — August OPEX

🎯 The read — thinner structure around spot; flow matters more until price reaches something with real weight

🔁 If this work helps you during the trading day, share or restack it.

📺 Join me live at 8:30 AM ET:
YouTube Live
X/Twitter Live

QUANTUITION — Analytics + Edge from Experience. 🐐
file_ojIHnryuJJRez
file_fB7O4XPVWPOs6
file_GghQpZd0vDG5A
Profile picture
Doc McGrawProfile picture@doctradermcgraw·3d

S&P 500 Opens Quiet Ahead of a Week That Loses Both Its Anchors

Monday, August 17 — MOPEX and VIX expiration land three days apart

🔴 LIVE — 8:30 AM ET · YouTube and X

YouTube Live
X/Twitter Live

👀 ABOVE THE FOLD

Third straight weekly gain, longest streak since May — S&P up roughly 4% month-to-date
• Overnight held a ~20 point range, topping near 7800, slightly green most of the session
VIX popped ~5% off Friday’s close toward 15, futures near 15.5
The positioning center of gravity sits below spot, but a 24-point straddle says the market is not pricing much movement today
• The week’s real story is mechanical — VIX monthly expiration Wednesday, August OPEX Friday

🔁 If the Daily Plan helps you see the market more clearly, share or restack it. Someone else may be staring at the same chart wondering what they’re missing.

🧭 CONTEXT

Friday closed 7785.76, down 0.17%, in a 33.70-point range — less than half of what it was priced for. The weakness traced to 10 AM, when U. Michigan Consumer Sentiment missed.

The week ran roughly 7739 to 7816.70, with Thursday’s record close at 7799 and the 7816.70 intraday all-time high still unretaken.

Breadth confirmed the record. Advancers ran roughly two to one Thursday, more than half the components were above their 20-day, and both RSP and QQQE closed at all-time highs alongside the cap-weighted index. The Russell challenged its highs as well. High beta was favored while money rotated out of lower-volatility names.

That is a broad tape — not seven names dragging everybody across the line.

One backdrop still worth remembering is July.

The Situational Awareness unwind was the big rock hitting the pond. The first splash was obvious. Then the pendulum swung the other way, SPX recovered and August produced another record close.

That does not mean July’s unwind caused today’s options structure. It does mean large positioning events can leave smaller second- and third-order ripples as exposure gets rebuilt and risk gets redistributed.

Now we get to see what is actually underneath price as two important expiration structures come off.

🗓️ EVENTS & EARNINGS

Monday 8/17
8:30 — NY Fed Manufacturing
10:00 — NAHB Housing Market Index
AH — $FN

Tuesday 8/18
BTO — $HD
ATC — $KEYS

Wednesday 8/19
VIX monthly expiration
2:00 — FOMC minutes
BTO — $LOW, $TGT, $ADI, $TJX, $VIK

Thursday 8/20
8:30 — Initial Claims, Continuing Claims
BTO — $WMT, $DE, $ROST, $BABA

Friday 8/21
August OPEX

Light macro Monday. Neither scheduled print should dominate the session on its own.

The week’s better consumer read-through comes from retail earnings, following Friday’s Retail Sales and U. Michigan sentiment miss, with $WMT landing the day before OPEX.

Ahead: Wednesday 8/26 — PCE and $NVDA, same session · Aug. 27–29 — Jackson Hole

📏 LEVELS & LINES — THE PLAYING FIELD

Expected Move

08/17/26: EM/Straddle: 24.05 (ref. SPX 7795) → 7770 <> 7820 Monday

08/19/26: EM/Straddle: 49.15 (ref. SPX 7795) → 7745 <> 7845 VIXpery

08/21/26: EM/Straddle: 69.30 (ref. SPX 7795) → 7725 <> 7865 MOPEX

08/28/26: EM/Straddle: 122.15 (ref. SPX 7795) → 7670 <> 7920 Friday (NVDA + J-Hole)

08/31/26: EM/Straddle: 132.40 (ref. SPX 7795) → 7660 <> 7930 Month End

Prior session — high 7810.01 · low 7776.31 · close 7785.76

Week 8/10–8/14 — high 7816.70 · low ~7739

Overnight — quiet, roughly 20 points, topping near 7800

TA reference

7816.70 — intraday all-time high, Thursday, never retested
7799 — record close
7700–7800 — broader consolidation area
7620 — old highs, former resistance taken out
7600 — unfilled gap
20-day MA 7555 · 50-day MA 7505 — separating, holding their spacing

Light structure read: the strongest nearby stabilizing inventory sits below spot. There is a first catch above it, while the positioning immediately around spot is thinner and more reactive. Above price, long inventory is present but modest.

That gives the tape a lower center of gravity without making a directional prediction.

🐐 The free section gives you the playing field. Below the paywall: the full positioning terrain, today’s SPX Road Map, premium-selling framework, TradingView levels and Cheat Card.

Subscribe for the full Daily Plan:

🌡️ VOL & POSITIONING FRAME

Friday’s close: VIX 14.25 (−2.60%) · VIX9D 10.61 (−6.68%) · VVIX 87.48 (−2.17%)

This morning: VIX near 15, up roughly 5% · /VX near 15.5

Friday reversed the week’s vol story. Everything came in hard — VIX9D fell almost 7%, while VVIX finally broke lower after holding up through much of the week.

The arc was straightforward: bid into CPI, held through PPI, firmed Thursday while SPX made a record close, then collapsed Friday once the calendar cleared.

Term structure: 10.61 → 14.25 → 18.46.

That is steep contango. The front end has surrendered while the back end still carries meaningful premium.

Wings bid, middle ignored. Tail demand remained firmer, ATM vol softened, skew stayed relatively flat. The interesting demand has been more upside than downside.

HV20 near 14% remains distorted by the late-July reversal sessions still sitting in the window. As those observations roll off, the implied-realized spread can widen mechanically without VIX having to move.

Into Wednesday: dealer-long VIX inventory sits across roughly 16 to 17.5, with the character changing above 18. VIX near 15 is still below that cluster.

The working behavior is pull-and-repel: attraction toward the lower edge, increasing resistance as VIX pushes deeper into the cluster.

15.25–15.75 remains the working near-term range, not a promise. A sustained move through 16 would tell us something has changed.

The McMillan VIX trend buy remains in effect while VIX holds below its 200-day near 18.50. That also lines up with the neighborhood where dealer containment thins.

Two frameworks, same general area.

🎯 LEVELS & LINES — TERRAIN

📏 7830 — 1.5x EM, upper stretch

📏 7820 — EM top

7805–7815 — modest dealer-long inventory above spot. Enough to create reaction, not enough to call a hard ceiling.

🧭 7795-ish — current area. Positioning immediately around spot is relatively thin and mixed.

📦 7775 — first real stall below. Meaningful dealer-long positioning and the first catch on a pullback.

📏 7770 — EM bot

📦 7755 — dominant nearby cushion. The largest stabilizing concentration on the board, but contested rather than automatic.

As price approaches from above, dealer hedging can begin adding buying flow into the decline before the strike itself trades. How much that matters depends heavily on volatility. If vol stays contained, the cushion should have more room to work. If vol expands hard, the stabilizing effect can be weakened or overwhelmed.

📏 7745 — 1.5x EM and lower shelf edge

🧱 7725 — second shelf, the structure under the structure

TODAY’S PATH

Upside: 7795 → 7805/7815 → 7820 → 7830

Downside: 7795 → 7775 → 7770 → 7755 → 7745

The positioning center of gravity sits below spot. The strongest nearby long inventory is concentrated around 7755, with 7775 acting as the first catch and relatively little grip between current price and those lower shelves.

What the structure does not tell us is timing.

A 24-point straddle says the market is not paying for much movement today.

Both things can be true.

🗺️ SPX ROAD MAP 0DTE

CHOP ZONE — 7775 to 7815

Spot sits inside this range. The edges are actual reaction areas, not arbitrary round numbers. Inside the zone, positioning is mixed and comparatively thin.

Expect two-way movement without much follow-through until an edge gives.

IF price rejects 7805–7815 and turns back down → look for rotation toward the middle and then 7775. That is normal range behavior, not yet a breakdown.

IF price holds the 7780s on a pullback → the thin middle continues to hold together. Chop remains the better description.

ABOVE THE CHOP ZONE — 7815 UP

IF price accepts above 7815 → 7820 is the EM top immediately overhead.

IF 7820 converts from resistance to support → 7830 becomes the next stretch.

Above the expected-move rail is expansion territory, not simply another rotation inside the morning range.

IF price wicks through 7820 and fails → the rail did its job.

Do not treat a wick through a level as acceptance.

BELOW THE CHOP ZONE — 7775 DOWN

IF 7775 gives → 7770 is the EM bot immediately underneath. Treat those as one decision area rather than two separate trades.

IF price begins working toward 7755 → expect stabilizing hedging flow to start building into the decline if volatility remains contained.

7755 is the strongest nearby cushion, but it is contested.

A reaction is one thing.

A hold is another.

IF 7755 fails with vol expanding → 7745 is where the 1.5x rail and lower shelf meet.

Below that, 7725 is the next meaningful dampening structure and sits outside today’s normal frame.

💰 PREMIUM SELLERS

The front end is compressed — a 24-point SPX straddle with VIX9D barely above 10.

You are selling thin premium.

And thin premium is thin for a reason.

This week, the backdrop changes twice: VIX expiration Wednesday and August OPEX Friday.

Contained tape can remain friendly to premium sellers while the existing structure is intact. The important part is not assuming that the same containment automatically survives each expiration.

If you are selling premium, size for the week you are in, not the one that just ended.

Patience is a position too.

🎯 BOTTOM LINE

Two books matter this week.

The VIX structure is helping absorb movement in volatility.

The SPX structure is helping shape movement in price.

Wednesday changes the first. Friday changes the second.

The following Wednesday brings PCE and $NVDA with both expiration events already behind us.

The current SPX positioning has its center of gravity below spot, with the strongest nearby stabilizing concentration around 7755 and only modest long inventory overhead.

But today’s 24-point straddle says the market is not pricing much travel.

Those facts are not contradictory.

One tells us where the structure is strongest.

The other tells us how much movement the market is currently willing to pay for.

That is Monday.

Mechanics, not data.

If you don’t know where the flows are, you’re not analyzing markets. You’re narrating them.

📊 TRADINGVIEW STRINGS

MAIN

$SPX: shelf, 7725, lower rail, 7745, cushion, 7755, EM bot, 7770, stall, 7775, upper reaction, 7810, EM top, 7820, upper stretch, 7830

$ES1!: shelf, 7746, lower rail, 7766, cushion, 7776, EM bot, 7791, stall, 7796, upper reaction, 7831, EM top, 7841, upper stretch, 7851

$SPY: shelf, 772.5, lower rail, 774.5, cushion, 775.5, EM bot, 777, stall, 777.5, upper reaction, 781, EM top, 782, upper stretch, 783

SCALPER

$SPX: prior low, 7776, prior close, 7786, overnight high, 7800, prior high, 7810, ATH, 7817

$ES1!: prior low, 7797, prior close, 7807, overnight high, 7821, prior high, 7831, ATH, 7838

$SPY: prior low, 777.6, prior close, 778.6, overnight high, 780, prior high, 781, ATH, 781.7

🐐 CHEAT CARD

Spot ~7795 · Straddle 24.05 · Rails 7770 <> 7820

Chop 7775–7815

Above 7815 → 7820 → 7830

Below 7775 → 7770 → 7755 → 7745

7755 — strongest nearby cushion; stabilizing buying flow can begin building into it if vol stays contained

VIX ~15 · working near-term area 15.25–15.75

This week — VIXpery Wed · MOPEX Fri

The read — positioning center of gravity below spot, but premium prices a quiet Monday

🔁 If this work helps you during the trading day, share or restack it. That is still the best way to help other traders find the Daily Plan.

📺 Join me live at 8:30 AM ET:
YouTube Live
X/Twitter Live

QUANTUITION — Analytics + Edge from Experience. 🐐
file_A553Tunom57go
file_KsdyjXoNRhyRA
file_RjGXnV0Jp57Cr
Profile picture
Doc McGrawProfile picture@doctradermcgraw·6d

📈 S&P 500 at Record Highs After CPI and PPI — Does Retail Sales Confirm the Rally?

Doc’s S&P 500 Daily Plan — Friday, August 14, 2026

🔴 LIVE at 8:30 AM ET
YouTube:
X:

👀 ABOVE THE FOLD

Retail Sales 8:30. Business Inventories and preliminary UMich Sentiment at 10:00.

📏 Expected Move: 7780 <> 7830. About 25 points either side — tight for another data morning.

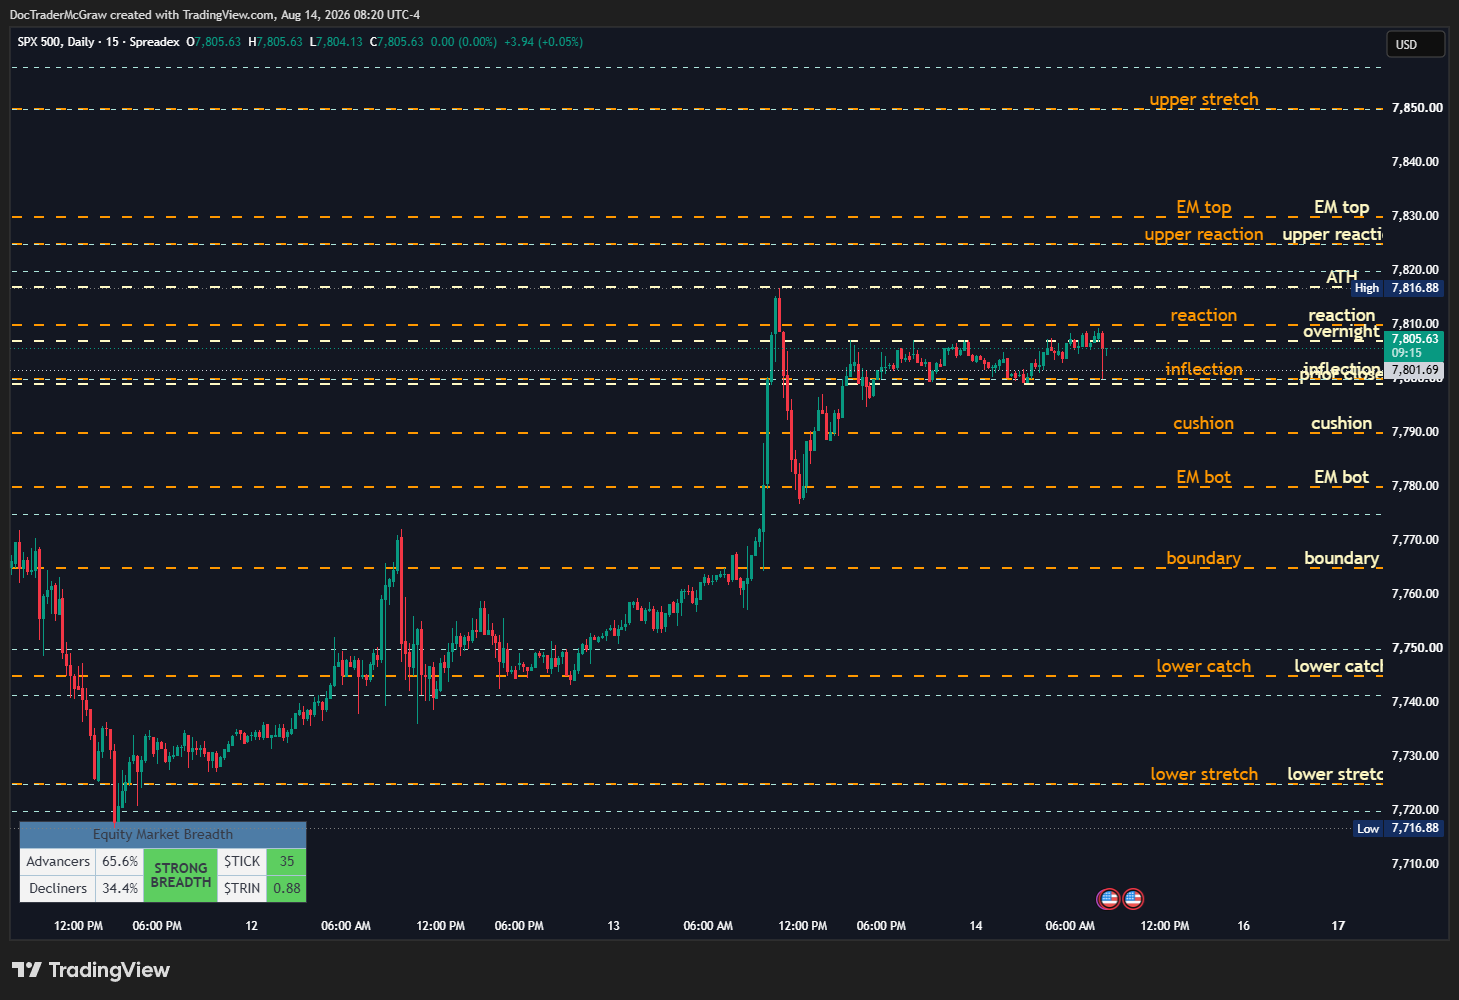
🧭 7790–7825 is today’s ladder. Spot sits inside it, just above the 7800 character line.

🔺 7816.88 is Thursday’s all-time high — important, but sitting inside the ladder rather than above it.

📦 Breadth confirmed the record. Equal-weight participation came with the index rather than watching from behind.

🧭 CONTEXT

SPX closed 7799 Thursday, up 0.65%, at a record close. Session low was 7763 and the high reached 7816.88, another intraday all-time high.

Thursday’s Expected Move was 7735 <> 7790. SPX closed above the upper rail and the session high nearly reached the 2x extension before rotating back.

Nasdaq gained 0.8%. The Dow was essentially flat.

The catalyst was straightforward: PPI followed CPI with another friendly inflation read.

Two inflation prints, same direction.

That made the rate path easier for the market to believe.

Breadth confirmed it. Advancers ran roughly two to one, and both RSP and QQQE joined the cap-weighted index at all-time highs.

That matters. This was not seven stocks dragging the market over the finish line.

Software led the rate-sensitive response, megacap participated, and semis came along without leading. $CSCO and Cerebras remained weak after earnings. $AMAT traded lower after its report, but the move stayed contained rather than becoming a broader semiconductor break.

Overnight held the move. SPX is around 7807, above Thursday’s close, and repeated tests around 7800 have found buyers. Thursday’s 7816.88 high has not yet been cleared.

Now Retail Sales.

CPI and PPI told us about prices. Retail Sales tells us about demand.

Soft inflation with resilient demand is one thing.

Soft inflation because the consumer is weakening is something else.

UMich adds the expectations read at 10:00.

🗓️ EVENTS & EARNINGS

Friday, August 14

8:30 AM — July Retail Sales
The demand-side check on two friendly inflation prints. Cooling inflation with a resilient consumer supports the current setup. Weak demand changes the reason inflation is cooling.

📊 10:00 AM — June Business Inventories

🗣️ 10:00 AM — Preliminary August UMich Sentiment

📅 AHEAD

Wednesday, August 19 — Monthly VIX expiration
Friday, August 21 — August OPEX

📏 LEVELS & LINES — TODAY’S PLAYING FIELD

Expected Move: 7780 <> 7830

Thursday: 7763 low · 7816.88 high · 7799 close

Week to date: 7717 low · 7816.88 high

Next Friday rails: 7720 <> 7890

Record close: 7799
Intraday ATH: 7816.88

🧲 GAMMA SETUP — TOP LINE

Dealer positioning changes character around 7800.

Below it, nearby dealer-long positioning provides more dampening. Above it, the short-call ladder becomes increasingly important through 7810 and 7825.

The strongest nearby cushion sits around 7790.

That gives us the working ladder:

7790 → 7800 → 7810 → 7817 → 7825 → 7830

Each rung can change the behavior of the next move.

And today’s Expected Move lands almost perfectly around the same structure:

7780 below. 7830 above.

The options market and the positioning map are pointing at the same neighborhood.

The straddle isn’t a forecast. It’s a receipt for what somebody already paid to be positioned. Yesterday priced much more movement than the market ultimately used. Today’s says roughly twenty-five points either side after a record close. What happens when price reaches the structure everybody has already paid around is below.

🐐 Full Vol & Positioning, Road Map, Premium Sellers, TradingView strings and Cheat Card below.

🔒 PAID

🌡️ VOL & POSITIONING FRAME

Thursday gave us an unusual combination:

Spot up. Vol up.

VIX closed around 14.60, VIX9D around 11.31, while VVIX also firmed slightly.

That is not automatically fear.

Customers bought back short calls and added upside exposure into the rally. Dealers selling those calls hedge by buying stock as price rises.

That can push spot and implied volatility higher together.

The wing indices told a similar story: a small bid for the edges while at-the-money volatility remained subdued.

Nobody is paying heavily for the middle. Somebody is paying for upside.

📦 7790 — Cushion: Strong nearby dealer-long positioning gives pullbacks something to press against.

🧭 7800 — Character line: Below it, hedging is more dampening. Above it, the short-call ladder matters more.

7810–7825 — Short-call ladder: Dealer shorts can force buying into strength, but the rungs alternate. Price can accelerate into one level, stall at the next, then accelerate again.

Thursday’s 7816.88 ATH sits inside that ladder. It matters as price history, not as the end of the structure.

⚠️ 7765 — Lower boundary: Below here the nearby dampening thins materially. The next meaningful catch is around 7745.

🎯 LEVELS & LINES — TODAY’S TERRAIN

🔺 7845 — Upper Stretch: 1.5x area and first meaningful reference beyond today’s Expected Move.

📏 7830 — EM Top: Upper Expected Move and the exit from the nearby short-call ladder. Acceptance above changes the map.

7825 — Upper Reaction: Large dealer-short call positioning. An approach can accelerate as hedging moves with price; rejection puts the ladder back in play.

🔺 7817 — ATH: Thursday’s 7816.88 high. Important price reference, but it sits inside the ladder rather than at its edge.

7810 — First Reaction: First meaningful dealer-short area above spot. Clear it and 7817/7825 opens.

🧭 7800 — Inflection: The main character line. Above it, the short-call ladder matters more; below it, dealer-long positioning begins to dampen.

📦 7790 — Cushion: Strong nearby dealer-long positioning and the lower edge of the ladder. Hold/reclaim favors rotation back toward 7800.

📏 7780 — EM Bot: Lower Expected Move inside the broader dampened area.

⚠️ 7765 — Lower Boundary: The more important downside character change. Acceptance below means nearby dampening has thinned materially.

🔻 7745 — Lower Catch: First meaningful dealer-long structure below the boundary.

TODAY’S PATH

Upside: 7800 → 7810 → 7817 → 7825 → 7830 → 7845

Downside: 7800 → 7790 → 7780 → 7765 → 7745

🗺️ SPX ROAD MAP 0DTE

CHOP ZONE — 7790 <> 7825

The ladder itself is the chop zone. Expect price to work through individual rungs rather than treat the entire range as one clean break.

IF 7800 holds → 7810 is the first upside press.

IF >7810 and accepts → 7817, then 7825.

IF 7810 rejects → 7800, then 7790.

IF 7817 rejects → reverse-test 7810, then 7800.

IF <7800 and accepts → 7790 becomes the first downside decision.

IF Retail Sales leaves price inside 7790–7825 → the ladder remains intact and the 10:00 data becomes the next catalyst.

ABOVE CHOP

IF >7825 and accepts → 7830.

The top rung gives way and the upper Expected Move is immediately next.

IF 7830 rejects → 7825, then 7817/7810.

IF >7830 and accepts → 7845 becomes live.

Price has now cleared both the ladder and the Expected Move.

IF 7845 rejects → reverse-test 7830.

BELOW CHOP

IF <7790 → 7780.

Still inside the more dampened portion of the board.

IF 7780 holds → reverse-test 7790, then 7800.

IF <7780 and accepts → 7765 becomes the important downside decision.

IF 7765 holds → reverse-test 7780.

IF <7765 and accepts → 7745 becomes live.

Nearby dampening has thinned and price has more room to travel.

IF 7765 reclaims from below → failed break → 7780, then 7790.

Accept above a reaction zone and the next zone opens. Reject it, or clear it and fall back inside, and price reverse-tests prior ranges. Do not treat a wick through a level as acceptance.

💰 PREMIUM SELLERS

1.0x — 7780 <> 7830

A 50-point box on a Retail Sales morning.

Both rails sit near real structure. That is the argument for it.

The relatively small amount of premium after two major inflation prints and a record close is the argument against it.

1.5x — roughly 7765 <> 7845

Cleaner geography.

The put side reaches the lower structural boundary. The call side clears the short-call ladder and upper Expected Move.

The wings are not symmetric.

🔺 CALL SIDE

Dealers are short calls through roughly 7810–7825.

An upside move can force them to buy into strength.

Selling calls directly into that approach means selling into potential forced buyers.

🔻 PUT SIDE

Dealer-long positioning around 7790–7780 gives the downside more immediate cushion.

That changes if 7765 fails.

Sometimes the best premium trade is recognizing you’re not being paid enough to sell it.

🎯 BOTTOM LINE

Two friendly inflation prints.

A record close.

Breadth confirmed it.

Now Retail Sales tells us whether the demand side agrees.

7800 is the character line.

Hold it → 7810 → 7817 → 7825

Accept above 7825 → 7830 → 7845

Lose 7800 → 7790 → 7780

The bigger downside change does not arrive until 7765 fails.

7790–7825 is the ladder.

Today is less about one magic breakout level and more about how price behaves as it climbs — or descends — through the rungs.

📊 TRADINGVIEW STRINGS

MAIN

$SPX: lower catch, 7745, boundary, 7765, EM bot, 7780, cushion, 7790, inflection, 7800, reaction, 7810, upper reaction, 7825, EM top, 7830, upper stretch, 7845

$ES1!: lower catch, 7766, boundary, 7786, EM bot, 7801, cushion, 7811, inflection, 7821, reaction, 7831, upper reaction, 7846, EM top, 7851, upper stretch, 7866

$SPY: lower catch, 774.5, boundary, 776.5, EM bot, 778, cushion, 779, inflection, 780, reaction, 781, upper reaction, 782.5, EM top, 783, upper stretch, 784.5

SCALPER

$SPX: lower catch, 7745, boundary, 7765, EM bot, 7780, cushion, 7790, prior close, 7799, inflection, 7800, overnight, 7807, reaction, 7810, ATH, 7817, upper reaction, 7825, EM top, 7830

$ES1!: lower catch, 7766, boundary, 7786, EM bot, 7801, cushion, 7811, prior close, 7820, inflection, 7821, overnight, 7828, reaction, 7831, ATH, 7838, upper reaction, 7846, EM top, 7851

$SPY: lower catch, 774.5, boundary, 776.5, EM bot, 778, cushion, 779, prior close, 779.9, inflection, 780, overnight, 780.7, reaction, 781, ATH, 781.7, upper reaction, 782.5, EM top, 783

ES basis running approximately +21 this morning. Verify against futures before loading.

🐐 CHEAT CARD

SPX 0DTE — FRI AUG 14

RETAIL SALES 8:30 · INVENTORIES + UMICH 10:00

📏 EM 7780 <> 7830

🔺 7845 — UPPER STRETCH

📏 7830 — EM TOP

7825 — UPPER REACTION

🔺 7817 — THURSDAY ATH

7810 — FIRST REACTION

🧭 7800 — INFLECTION

📦 7790 — CUSHION

📏 7780 — EM BOT

⚠️ 7765 — LOWER BOUNDARY

🔻 7745 — LOWER CATCH

QUICK READ

Hold 7800 → 7810 → 7817 → 7825

Accept >7825 → 7830 → 7845

Lose 7800 → 7790 → 7780

Accept <7780 → 7765

Accept <7765 → 7745

Reject a press → reverse-test prior ranges back toward 7800

Do not treat a wick through a level as acceptance.

📣 If this helped you get oriented before the open, restack it or send it to someone trading SPX today.

Trade today’s market. Understand tomorrow’s.
Daily preparation. Lasting market education.

QUANTUITION — Analytics combined with Edge from Experience. 🐐

file_DFXFEOKqCgbSB
file_eV9zspA1GvYwd
file_nXXAyEreeiOjs
Profile picture
Doc McGrawProfile picture@doctradermcgraw·Aug 13

📈 S&P 500 Has Gone Nowhere for Four Days — Does PPI Finally Break the Range?

Doc’s S&P 500 Daily Plan — Thursday, August 13, 2026

🔴 LIVE at 8:30 AM ET — YouTube and X

👀 ABOVE THE FOLD

PPI 8:30. Fed speakers surround the print from 8:15–8:45, then the 30-year Treasury auction at 1:00.

📏 Expected Move: 7735 <> 7790. Roughly 27.5 points either side — about half of what CPI carried yesterday.

🧭 7750 is the inflection. Hold it and 7775–7780 becomes the upside press. Lose it and 7735 comes back into play.

7775–7780 is the acceleration area. Dealers are short calls there and can be pushed into buying with price.

📦 7800 is the absorber above. 7700/7690 is the stacked shelf below. Those are the larger structural edges.

🧭 CONTEXT

The S&P 500 closed up 0.3% near 7749 Wednesday, a tick under 7750 and roughly nine points below the record close.

Overnight, SPX added roughly 18 points toward 7763, putting price back near Wednesday’s opening area.

CPI landed close enough to expectations that the market accepted the softer inflation read. The straddle carried roughly 45–50 points and SPX used less than 30.

Event premium came out fast. Price didn’t go very far.

That gives PPI a simple job this morning:

confirm what the market accepted yesterday — or challenge it.

Four sessions have now passed on top of last week’s breakout without meaningful extension. Small bodies, wicks both ways, repeated rotations.

That does not automatically read as weakness.

Price ran quickly and is now letting time do some of the work instead of giving the move back.

The 20-day and 50-day moving averages are separating after spending much of July stacked together. The 20-day sits around 7555, the 50-day near 7505.

My old TA mentor called the healthy version railroad tracks — both averages rising roughly parallel, maintaining their spacing.

The separation has happened a little quickly, but not enough yet to call it stretched.

Price is chopping while the structure underneath catches up.

🗓️ EVENTS & EARNINGS

Thursday, August 13

🗣️ 8:15–8:45 AM — Fed speakers around the data
Hammack before the print, Barkin immediately after. With CPI yesterday and PPI this morning, the market gets the data and the Fed reaction almost back-to-back before the open.

8:30 AM — PPI + Initial Jobless Claims
PPI gets the next vote after Wednesday’s CPI. Does it confirm the softer inflation read the market accepted yesterday, or push back against it? Claims add the labor-market check.

🏦 1:00 PM — 30-Year Treasury Auction
The long end gets another vote this afternoon. A clean auction supports the post-CPI/PPI rates backdrop; a weak one can put yields back in play.

🤖 AI / TECH READ-THROUGH

$CSCO is the main overnight negative. The read is not that AI capex suddenly broke. Enterprise networking simply failed to clear a high expectations bar.

$NBIS was the better AI-infrastructure read.

Put them together: AI demand can remain strong while individual parts of the stack get punished when expectations outrun the print.

Watch whether $CSCO weakness stays contained or spreads into the broader AI/semiconductor complex.

💵 EARNINGS

Before Open: $JD · $LUNR · $TPR
After Close: $AMAT

$AMAT is tonight’s main read-through for semis and the AI-capex chain — equipment demand, memory/HBM, leading-edge spending and China exposure.

📏 LEVELS & LINES — TODAY’S PLAYING FIELD

Expected Move: 7735 <> 7790

Yesterday: open ~7765 · low just below 7740 · close ~7749

Week to date: 7717 low · 7774 high

Record close: ~7758
Intraday ATH: 7795
20-day: ~7555
50-day: ~7505

THE GAMMA SETUP — TOP LINE

Dealer-long positioning is concentrated around the edges of the broader 7700–7800 area.

The middle is more short-gamma dominated.

7700/7690 remains the stacked dealer-long shelf below.

7775–7780 is where dealers are short calls and can be pushed into buying strength.

7800 is the large dealer-long absorber overhead.

The important distinction:

Acceleration into 7800 does not make 7800 a ceiling. It means the behavior should change when price gets there.

The straddle isn’t a forecast. It’s a receipt for what somebody already paid to be positioned. Yesterday’s receipt said roughly fifty and the market spent less than thirty. Today’s says twenty-seven and a half. What that tells us about who is covered — and who isn’t — is below.

🔒 PAID

🌡️ VOL & POSITIONING FRAME

VIX closed around 14.65, with a session low near 14.40. VIX9D remains very low and VVIX continued to bleed Wednesday.

The event premium that existed for CPI has not rebuilt for PPI.

That cuts both ways.

A confirming print has less premium left to crush.

A surprise has less protection already sitting in the tape.

📦 7700/7690 — DEALER-LONG SHELF

Dealers should initially hedge against weakness here, creating a real cushion.

⚡ MIDDLE — SHORT-GAMMA DOMINATED

Less dampening. Moves can extend farther before finding enough positioning to slow them.

⚡ 7775–7780 — CALL ACCELERATION

Dealers are short calls through this area. Strength can force additional buying.

📦 7800 — ABSORBER

Dealer-long positioning becomes dominant and dampening increases.

Dampening is not a stop sign.

If price accepts above 7800 despite that absorption, 7825–7830 becomes the next upper reaction area.

🎯 LEVELS & LINES — TODAY’S TERRAIN

7750 — INFLECTION

Closed beneath it. Overnight back above it.

Hold above → support function.
Lose and accept below → resistance function.

7775–7780 — ACCELERATION

Dealers are short calls through this band.

An upside press can force dealer buying and help carry price toward the upper Expected Move.

The question is what happens when that forced buying is filled.

7790–7795 — UPPER RAIL / ATH AREA

7790 is today’s upper Expected Move.

7795 is the untested intraday ATH.

First major reaction area after the acceleration band.

7800 — ABSORBER

Largest dealer-long position on the board.

Price arriving here meets hedging that works against the move rather than with it.

The character changes.

Acceptance above is still possible.

7825–7830 — NEXT UPPER REACTION

Acceptance through the 7800 absorber puts this area in play.

7735 — LOWER RAIL

Today’s lower Expected Move and the bottom of the immediate chop zone.

7720–7725 — PULLBACK LANE

Thin area underneath yesterday’s chop.

7717 — WEEK LOW

First important price reference below the pullback lane.

7700/7690 — STACKED SHELF

Dealer-long positioning remains concentrated here.

This is where reactions become more likely — not where price is guaranteed to stop.

7660–7650 — LOWER CATCH

If the 7700/7690 shelf fails, dealer positioning rebuilds hard in this lower zone.

🗺️ SPX ROAD MAP 0DTE

CHOP ZONE — 7735 <> 7775

IF 7750 holds → 7775 becomes the upside press.

IF 7750 fails and holds below → 7735 becomes the downside press.

IF price remains 7735–7775 after PPI → the 1:00 Treasury auction becomes the next catalyst.

ABOVE CHOP

IF > 7775/7780 and accepts → 7790, then 7795.

Dealer short-call positioning can accelerate the approach.

IF 7790/7795 rejects → reverse-test 7775, then 7750.

IF > 7795 and presses 7800 → watch for the character change.

Dealer-long positioning should increase absorption.

IF 7800 rejects → 7790/7795 first, then 7775.

IF > 7800 and accepts despite absorption → 7825–7830 becomes live.

Different gamma environment. Slower does not mean stopped.

BELOW CHOP

IF < 7735 → 7720–7725.

IF < 7720 → 7717 week low.

IF 7717 fails → 7700/7690 stacked shelf.

Dealer-long positioning should begin working against the decline.

IF 7700/7690 holds or reclaims → 7735 becomes the reverse-test.

IF both 7700 and 7690 fail and price accepts below → character changes toward 7660–7650.

That is where meaningful dealer positioning rebuilds.

💰 PREMIUM SELLERS

1.0x — 7735 <> 7790

A 55-point box with PPI at 8:30 and the 30-year auction at 1:00.

27.5 points either side is not much premium for print risk.

The market is already pricing PPI as considerably smaller than CPI.

You are being asked to sell that assumption.

1.5x — roughly 7720 <> 7805

The call side reaches the dealer-long absorber.

The put side sits in the pullback lane with the larger 7700/7690 shelf underneath it.

Better structural geography than 1.0x.

But the wings are not symmetric.

🔺 CALL SIDE

Dealers are short calls through roughly 7775–7800.

An upside move can force them to buy into strength.

🔻 PUT SIDE

Dealer-long positioning at 7700/7690 gives the downside more structural cushion.

Acceptance beneath the entire shelf changes that read.

Sometimes the best premium trade is recognizing you’re not being paid enough to sell it.

🎯 BOTTOM LINE

Four sessions inside the same broad structure.

7750 is the immediate inflection.

Hold it → 7775–7780.

Lose it → 7735.

Accept through 7780 → 7790/7795, then the 7800 absorber.

Accept above 7800 → 7825–7830.

Lose 7735 → 7725 → 7717 → 7700/7690 shelf.

The market has already priced PPI as a much smaller event than CPI.

The question this morning is whether PPI confirms that assumption.

📊 TRADINGVIEW STRINGS

MAIN

$SPX: shelf low, 7690, shelf, 7700, pullback, 7725, inflection, 7750, accel, 7780, absorber, 7800, upper reaction, 7830

$ES1!: shelf low, 7711, shelf, 7721, pullback, 7746, inflection, 7771, accel, 7801, absorber, 7821, upper reaction, 7851

$SPY: shelf low, 769, shelf, 770, pullback, 772.5, inflection, 775, accel, 778, absorber, 780, upper reaction, 783

SCALPER

$SPX: week low, 7717, pullback, 7725, lower rail, 7735, prior low area, 7740, inflection, 7750, upper mid, 7775, accel, 7780, upper rail, 7790, ATH, 7795, absorber, 7800

$ES1!: week low, 7738, pullback, 7746, lower rail, 7756, prior low area, 7761, inflection, 7771, upper mid, 7796, accel, 7801, upper rail, 7811, ATH, 7816, absorber, 7821

$SPY: week low, 771.7, pullback, 772.5, lower rail, 773.5, prior low area, 774, inflection, 775, upper mid, 777.5, accel, 778, upper rail, 779, ATH, 779.5, absorber, 780

ES basis running approximately +21 this morning. Verify at the cash open before loading.

🐐 CHEAT CARD

SPX 0DTE — THU AUG 13

PPI 8:30 · FED 8:15–8:45 · 30YR AUCTION 1:00

📏 EM 7735 <> 7790

🔺 7825–7830 — NEXT UPPER REACTION

📦 7800 — ABSORBER
Character changes · dampening increases

🔺 7790–7795 — UPPER RAIL / ATH

7775–7780 — ACCELERATION
Dealers short calls · buying can build with price

🧭 7750 — INFLECTION

🔻 7735 — LOWER RAIL

🎯 7720–7725 — PULLBACK LANE

🔻 7717 — WEEK LOW

📦 7700/7690 — STACKED SHELF

⚠️ BELOW SHELF → 7660–7650 LOWER CATCH

QUICK READ

Hold 7750 → 7775/7780

Accept >7780 → 7790/7795 → 7800

Accept >7800 → 7825/7830

Lose 7750 → 7735

Lose 7735 → 7725 → 7717 → 7700/7690

Restack this if it helped. It’s how the room grows.

QUANTUITION — Analytics + Edge from Experience. 🐐
file_dOyE39ttS6uUo
file_E3OsNKPQ72s0E
file_y2eSx9g72vdFc
Profile picture
Doc McGrawProfile picture@doctradermcgraw·Aug 12

S&P 500 Daily Plan — Wednesday, August 12, 2026

7700 or 7800 — Or More of the Same?

The range has held for three sessions. Today it gets two chances to break.

🔴 LIVE — YouTube and X, 8:30 AM ET

👀 ABOVE THE FOLD

⚡ CPI 8:30, ten-year auction 1:00 — two rate events, one session

🤖 Overnight +20, $QQQ leading on AI earnings

📏 EM 7705 <> 7795 — tightened overnight, now sits right on the box

🧲 Dealer inventory sits at the edges of the range, not the middle

📦 7700/7690 is a stacked shelf below. 7800 the accelerant above

🧭 CONTEXT

Overnight is up about 20 points and $QQQ is leading.

The AI complex reported into Tuesday's bell and got a good read-through. That's what the tape spent the night pricing — earnings, not inflation.

Worth noting what Tuesday's close was and wasn't. Size worked the band into the final twenty minutes, walked price to 7717, brought it right back to 7728. That print was mechanical. The overnight bid is the first real opinion since Tuesday's open, and it isn't about CPI.

Underneath, Tuesday was healthier than the index suggested:

  • SPX −0.3%, equal weight +0.2%

  • Advancers over decliners on both exchanges

  • Energy led every sector at +1.2%, Hormuz hardening

  • Mega-cap technology was the entire drag

Overnight is the mirror image.

Now the print.

Futures rallied twenty points overnight and the expected move contracted. That tells you something. Read the press this morning and you'd think the number decides the year. The options market disagrees, and the options market has money on it.

That cuts two ways. A tape that isn't braced can be moved by less than usual. And a print near expectations leaves a lot of premium to bleed out of the front end fast.

When it hits, read composition over headline. Energy is the loosest part of the basket and it just led a session. A soft number that comes from the pump tells us less than broad cooling in core, shelter and services. The talking heads can argue the narrative later, when they've got nothing else.

Second rate event at one o'clock. $42 billion of ten-year paper, after the tape has already picked a side. The ten-year has been firming toward 4.70%.

🗓️ EVENTS & EARNINGS

Wednesday, August 12 8:30 AM — July CPI 1:00 PM — $42B 10-year Treasury auction Weekly VIX expiration

Thursday, August 13 8:30 AM — PPI

Friday, August 14 8:30 AM — Retail Sales

Ahead Wednesday, August 19 — VIX monthly expiration Friday, August 21 — August OPEX

🤖 The AI cluster

$CRWV, $SMCI and $LITE reported Tuesday night. $NBIS this morning. $CSCO tonight.

Aggregate it rather than trading it name by name. GPU cloud, servers, optics, networking — one common denominator, capex. $CSCO is the one that matters to the index: it answers whether the spend broadens past chips.

One gap is a stock story. The complex moving together is a market story.

📏 LEVELS & LINES — THE PLAYING FIELD

Expected move today: 7705 <> 7795 Friday's rails: 7655 <> 7805

Tuesday High 7730 · Low 7717 · Close 7728

Week to date High 7773 · Low 7717

Reference 7795 — all-time high, made at last Wednesday's open, never retested 7700 — floor of the three-day box, set the day after 7750 — the axis, where price kept returning until Tuesday afternoon

Overnight rallied twenty points and the expected move contracted. Today's rails now sit almost exactly on the three-day box — 7705 low, 7795 high. The options market and the price structure landed on the same two numbers.

The gamma setup, top line

For three sessions dealer inventory sat positive around price. That dampening is what produced the chop, and it has moved. What's left sits at the edges of the range.

The two largest dealer long positions on the entire board are stacked below at 7700 and 7690. The largest dealer short in the book sits overhead at 7800.

The broad middle is short-gamma dominated — not uniformly, there are local nodes and a two-way call ladder in the upper half that behaves differently going up than coming back down. Where that ladder starts, where it stops working, and what to do at each rung is on the board below.

🚨 CHECK THE SIGN BEFORE YOU SELL A CALL SPREAD TODAY

Most free gamma tools assume customers buy calls. So they show the strikes above price as dealer-friendly — dampening, safe to sell into — and the downside as the dangerous side.

Today the exchange data says the opposite.

If you're selling premium into this print off a naive screen, you may have the wings exactly backwards. Which side is actually dangerous, and why, is below.

🔒 PAID BELOW

⚠️ VOL & POSITIONING FRAME

VIX and VIX9D both closed lower Tuesday, both near session lows. VVIX came off and broke a four-session climb. The one-day was the only thing bid — the calendar showing up where it belongs.

Very little is being paid for anything past 8:30. That isn't confidence in the number. It's a front end with nothing left to sell.

The structure is the story today.

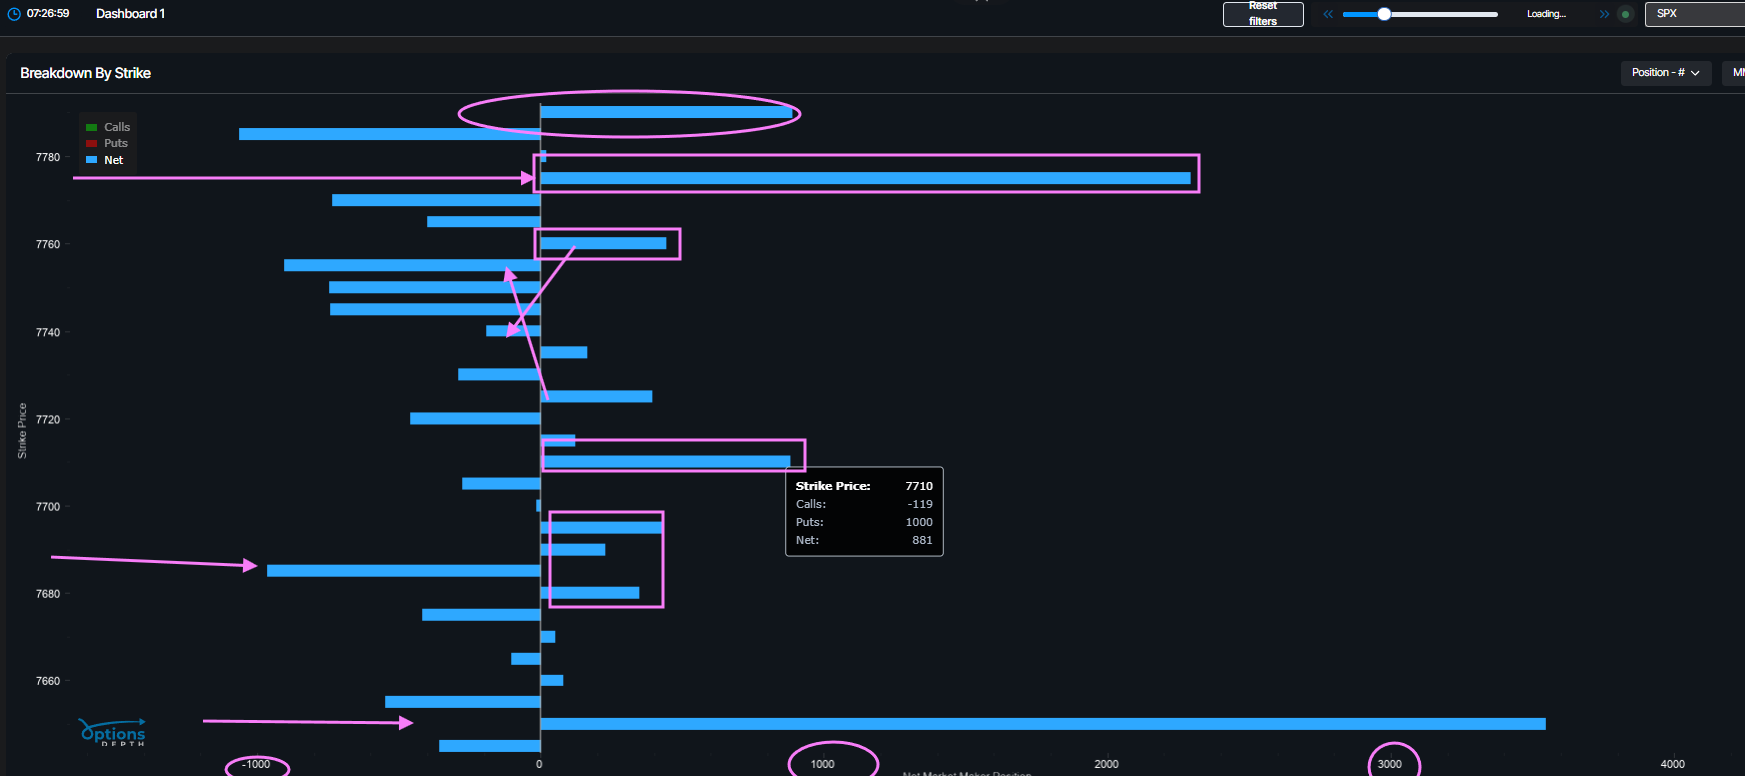
Dealers are long gamma below at 7700 and 7690 — the two biggest positions on the entire board, stacked one on the other, both driven by puts. Customers short them, dealers long, dealers absorbing.

That is a shelf, not a ledge. The downside has real structure under it, and it's two strikes deep.

Beneath the shelf gamma thins and turns negative for a stretch — likely the short leg of the spreads that built it. That's the slippery pocket. Positive inventory comes back in the 7650 to 7660 zone, and it's broad rather than one magic strike.

Above, the character is different. The broad middle is short-gamma dominated, though not empty at every strike. When dealers are long gamma they hedge against price — selling strength, buying weakness — and moves die where they start. Short, they hedge with price. A rally makes them buy. A break makes them sell. Approaches accelerate, reactions overshoot.

The two-way call ladder. The upper half isn't one wall, it's a series of rungs building toward 7795/7800. Going up, each rung adds fuel — dealers buying into strength. Coming back down, the same ladder unwinds with less underneath it than the way up suggested. Same structure, different behavior depending on direction.

📦 Dealer long inventory picks up again above 7805. Through 7800 the character changes.

🚨 WHICH WING IS ACTUALLY DANGEROUS

Free gamma tools assume customers buy calls, so they read overhead as dealer long and the downside as dealer short.

The exchange data says the opposite. Customers are short the downside puts, which leaves dealers long below you — the two biggest positions on the board. Dealers are short the calls overhead, so they buy into strength rather than sell into it.

For an iron condor that inverts the risk profile: the call side is the dangerous wing today, not the safe one.

📏 LEVELS & LINES — THE TERRAIN

THE FOUR THAT MATTER

7760 — the gate. Thin. Above it the call ladder engages and the upside opens. Below it price falls back into the chop.

7780 to 7805 — the upside decision area. 7780 is the first dealer long cluster above. 7795 is the EM high and the all-time high area. 7800 is the largest short in the book — approach accelerates because hedging goes with price. Through 7805, dealer inventory absorbs and the character changes.

7700 to 7690 — the stacked shelf. The two largest dealer long positions on the entire board, one on top of the other, sitting on the floor of the three-day box. Also today's EM low. This is where reactions become more likely, not where price is guaranteed to stop.

Below 7690 — the pocket. Thin and negative for a stretch. If the shelf fails and price accepts below it, the character turns slippery until the 7650–7660 zone, where positive inventory returns.

SUPPORTING

7745 overnight area, no structure · 7728 Tuesday's close · 7725 chop floor · 7717 prior low, reaction level

🗺️ SPX ROAD MAP 0DTE

CHOP ZONE — 7725 <> 7760

Overnight has us above it. The print resolves this fast.

IF SPX holds 7760 as resistance → back toward 7728 and the chop floor at 7725

IF SPX loses 7725 → 7717 prior low, then down to the shelf

IF SPX chops 7725 to 7760 all morning → print was a non-event, the day belongs to the auction

ABOVE THE CHOP ZONE

IF SPX clears 7760 and holds → the ladder engages toward 7780 Dealers buy into strength. It travels faster than the distance suggests.

IF SPX loses 7760 after clearing → the ladder unwinds, back to 7728, then 7725

IF SPX accepts above 7780 → 7795 in play Approach can accelerate rather than stall.

IF SPX reaches 7795 → expect a reaction EM high, all-time high area, largest short in the book right above. Bounce, rotation or exhaustion. Decision point, not a ceiling.

IF SPX rejects 7795/7800 → back toward 7780, possibly all the way to 7760

IF SPX accepts through 7805 → dealer inventory absorbs, the move slows rather than extends A soft print could be the excuse. Through it is a different tape, not more of the same.

BELOW THE CHOP ZONE

IF SPX tests the 7700/7690 shelf and holds → box floor confirmed, rotation back toward the middle Two largest dealer longs on the board sitting right there.

IF SPX undercuts 7700 and reclaims → failed break, back toward 7725

IF the 7700–7690 shelf fails and price accepts below → the thin pocket opens toward 7660/7650 This is the behavioral transition that matters today. Above the shelf, dealers absorb. Below it, they don't — until the 7650–7660 zone.

⚠️ The broad middle is short-gamma dominated. Moves through it extend further and faster than they have all week. Do not size off Monday and Tuesday.

💰 PREMIUM SELLERS

1.0x — 7705 <> 7795. Both rails arrive immediately adjacent to important structure. Lower rail sits on the shelf, upper rail at the EM high and the all-time high area.

1.5x — roughly 7655 <> 7805. Both rails arrive at the outside positive-gamma structures. The lower lands in the 7650–7660 zone, the upper above the absorber where premium dies.

2.0x — outside what the print is likely to reach, priced accordingly.

Practical ceiling is 7805. Nothing collectible below the 7650–7660 zone worth the tail.

The call side is the more dangerous wing today. Dealers are short into the highs and buy into strength — an approach to 7795 can run through a short strike rather than stall in front of it. The put side has the two biggest dealer longs on the board working for you.

Don't force symmetry on premium, delta or contract count.

🧠 BOTTOM LINE

Three sessions of chop, and today the range gets two chances to break — 8:30 and one o'clock.

7760 is the gate. Above it the call ladder engages toward 7780 and the decision area at 7795 to 7805. The approach can accelerate. The reaction when it arrives is the trade.

7700 to 7690 is the stacked shelf. The two largest dealer long positions on the board, sitting on the floor of the box. Lose it and accept below and the character turns slippery until the 7650–7660 zone.

Dealers absorb at the edges of this range and amplify through the middle. That's where behavior changes — not where price is guaranteed to stop.

And whatever your gamma screen says about the call side being safe this morning — check the sign before you sell it.

📊 TRADINGVIEW STRINGS

MAIN

$SPX: lower catch, 7655, shelf low, 7690, shelf em low, 7700, chop low, 7725, gate, 7760, em high, 7795, short gamma, 7800, absorption, 7805
$ES1!: lower catch, 7678, shelf low, 7713, shelf em low, 7723, chop low, 7748, gate, 7783, em high, 7818, short gamma, 7823, absorption, 7828
$SPY: lower catch, 766, shelf low, 769, shelf em low, 770, chop low, 772.5, gate, 776, em high, 779.5, short gamma, 780, absorption, 780.5

SCALPER

$SPX: shelf low, 7690, shelf em low, 7700, prior low, 7717, chop low, 7725, prior close, 7730, thin, 7745, gate, 7760, prior high, 7773, em high, 7795
$ES1!: shelf low, 7713, shelf em low, 7723, prior low, 7740, chop low, 7748, prior close, 7753, thin, 7768, gate, 7783, prior high, 7796, em high, 7818
$SPY: shelf low, 769, shelf em low, 770, prior low, 771.5, chop low, 772.5, thin, 774.5, gate, 776, prior high, 777.5, em high, 779.5

ES built off SPX plus 22.5 basis — verify against futures before the open. Scalper set goes stale after a full expected move.

🗂️ CHEAT CARD

SPX 0DTE — WED AUG 12 CPI 8:30 · AUCTION 1:00 · VIX WEEKLY EXPIRY

EM 7705 to 7795 · Box 7700 to 7795

GATE 7760 — above it the call ladder engages DECISION 7780 to 7805 — accelerate in, absorb through SHELF 7700 to 7690 — two largest dealer longs on the board POCKET below 7690 — thin until the 7650 to 7660 zone

MIDDLE OF THE RANGE IS SHORT GAMMA — MOVES EXTEND CALL SIDE IS NOT THE SAFE WING TODAY

📣 If this made your morning easier, restack it or send it to someone who trades the open.

QUANTUITION — Analytics + Edge from Experience. 🐐
file_kv4NDw5QxDUGZ
file_aI1Eo1FuxMPlH
file_8mNSqGeV7JOPj
Profile picture
Doc McGrawProfile picture@doctradermcgraw·Aug 11

S&P 500 Less Than Half a Percent From the All-Time High — CPI Tomorrow, What Decides Today?

Doc’s SPX Market Report — Daily Plan — Tuesday, August 11, 2026

🔴 JOIN ME LIVE AT 8:30 AM ET

YouTube Live:
X/Twitter Live:

👀 ABOVE THE FOLD

🧭 SPX comes into Tuesday less than half a percent below the all-time high, still inside the same three-day box and still close to the 7750 center that has controlled the tape.

🗓️ CPI lands tomorrow at 8:30 AM ET. Today is primarily a positioning session, with $SMCI after the close and the broader AI cohort reporting into Wednesday and Thursday.

🌪️ VIX remains under 16 while VVIX has been firming. Spot says calm. The volatility complex says protection has not disappeared.

📏 Today’s working 0DTE Expected Move is roughly 7720 <> 7780. The important question is what happens if price gets outside it.

🎯 7750 remains the central reference. The market has spent three sessions rotating around it without resolving the larger range.

🌙 OVERNIGHT

Quiet for most of Globex, then a modest lift into the European morning.

The implied SPX open is around 7760, slightly green and still close enough to the middle of the recent range that nothing meaningful has broken yet. ES pushed toward the upper end of its overnight range before easing back.

The important part is simple:

The box is still intact.

🧭 CONTEXT

Monday confirmed the market is still digesting.

SPX traded roughly 7743 to 7774 and closed flat at 7753, right back in the middle of the structure. Software and semiconductors went opposite directions, mega-cap was flat, breadth was mixed, and the index itself went nowhere.

That is what low correlation looks like in practice.

Individual names move, sectors trade places, and the index gets pinned because the pieces underneath it keep canceling one another out.

CPI is exactly the kind of common shock capable of changing that relationship.

The volatility complex is beginning to hint that the market knows the calendar is getting closer.

VIX remains cheap. VIX9D remains wrung out. But VVIX has been firming while spot volatility stays pinned, correlation has lifted from the floor, and the 10-year has been pressing toward 4.70%.

None of that predicts tomorrow.

It tells us what to watch if today’s quiet structure finally starts moving.

🗓️ EVENTS & EARNINGS

Tuesday, August 11

8:15 AM — ADP Weekly Employment Change
10:00 AM — Existing Home Sales
1:00 PM — 3-Year Note Auction
$SMCI — after close

Wednesday, August 12

8:30 AM — July CPI
Weekly VIX expiration
$NBIS — before open
$CSCO — after close
$CRWV — after close

Thursday, August 13

8:30 AM — PPI
$JD — before open
$AMAT — after close

Friday, August 14

8:30 AM — Retail Sales

Ahead

Wednesday, August 19 — Monthly VIX expiration
Friday, August 21 — August OPEX

📅 The sequence matters.

Tuesday can shade expectations.

Wednesday CPI gets the first real vote.

Thursday PPI confirms or complicates it.

Friday Retail Sales adds the growth side of the argument.

The AI cohort sits across the same window. One earnings reaction is a stock story. Several resolving together becomes a common-factor story capable of reaching semis, hyperscalers and eventually SPX.

⚡ WHY THE SIGN MATTERS

Dealer gamma changes how price behaves.

Long gamma: dealers hedge against the move. That tends to dampen, rotate and mean revert.

Short gamma: dealers hedge with the move. That can amplify and extend.

The level itself is not enough.

What matters is what behavior the positioning is capable of producing when price reaches it.

If that distinction helped, send this to someone still treating every gamma level like ordinary support or resistance.

📏 LEVELS & LINES — THE PLAYING FIELD

Working 0DTE EM: ~7720 <> 7780

Monday: 7743 <> 7774, close 7753
Three-day box: 7700 <> 7795

The free map stays simple.

🎯 7750 — central reference

The tape has repeatedly returned here while the larger range remains unresolved.

🔺 7795/7800 — major upper area

The all-time-high area sits immediately beneath meaningful overhead positioning.

🔻 7700 — major lower area

The bottom of the three-day box remains the larger downside character line.

Between those references are the zones that determine whether Tuesday stays rotational or begins to travel.

That is where the paid Road Map starts.

💰 New this week: a dedicated Premium Sellers section.

Not just:

How far away is the strike?

But:

What structure sits between spot and that strike, and what happens if price gets through it?

Below the paywall: the full gamma terrain, the IF/THEN Road Map, 1.0x and 1.5x Expected Move framing for premium sellers, volatility confirmation, TradingView strings and the Cheat Card.

Subscribe for the full Daily Plan.

🔒 PAID BELOW

⚠️ VOLATILITY & POSITIONING

The index still looks calm.

The volatility complex is less straightforward.

VIX remains under 16 and VIX9D sits in the 12s, while VVIX has been rising with spot volatility pinned. The Friday-to-Monday move barely changed SPX, yet protection underneath the surface became somewhat more expensive.

Plain English:

the tape is quiet, but protection is still being held.

That does not mean downside is coming.

It means a break from today’s structure deserves more respect if volatility confirms it.

WHAT CONFIRMS THE MOVE?

🌪️ Price leaves the gamma structure while VIX/VVIX firm
The new behavior has confirmation.

🌪️ Price pokes outside the structure while volatility refuses to respond
Be more suspicious of the extension.

📈 Tomorrow, yields matter too.
A CPI move accompanied by a meaningful move in the 10-year carries more information than SPX moving alone.

📏 LEVELS & LINES — THE FULL TERRAIN

The fresh gamma map is much cleaner when we stop treating every five-point strike as equally important.

There are three main structural neighborhoods.

🔻 7705–7725 — LOWER GAMMA ZONE

This is the primary downside catch.

The upper edge sits around today’s 7720 lower Expected Move, and the structure continues underneath toward roughly 7705.

Think zone, not magic strike.

Behavior: this area is capable of slowing price and producing rotation.

If SPX arrives here with volatility still contained, the first assumption should not be that every five-point break automatically means continuation.

What changes it: sustained trade through the lower end brings 7700 into focus.

🎯 7740–7760 — MIDDLE GRIP

This is today’s main control area.

7750 sits in the middle of it, but the whole zone matters more than the single number.

Inside roughly 7740–7760, the structure favors absorption and two-way trade.

Behavior: rotation, shorter extensions, faster harvesting.

Repeated failures to hold outside the zone confirm that the grip is still doing its job.

🔺 7810–7830 — UPPER GAMMA ZONE

This is the meaningful upper structural area.

Importantly, it sits outside today’s Expected Move.

The market has to earn its way there first.

If SPX clears the upper part of today’s expected range and trades through the ATH area, 7810–7830 becomes a reaction zone capable of slowing or reorganizing the move.

Not a destination.

A place where the next decision has to be made.

⚡ 7775–7780 — UPSIDE PERMISSION / TOP OF EM

This is the important transition above the middle grip.

7775 begins the change.

7780 is roughly today’s upper Expected Move.

Acceptance above that area means price has escaped the immediate dampening structure.

That can produce a quicker traverse toward the next reaction area around 7795–7810.

The acceleration is toward that area, not through it.

🔻 7735–7740 — DOWNSIDE DRIFT AREA

This is the corresponding lower transition.

Lose the middle grip and this is the first sign that price is beginning to travel toward the lower gamma zone.

Below it, 7725/7720 becomes live.

⚠️ 7700 — CHARACTER LINE

The lower gamma zone ends just above it.

That distinction matters.

The 7705–7725 zone can still cushion.

Acceptance below 7700 means the cushioning structure itself has failed.

🗺️ SPX ROAD MAP 0DTE

WITHIN THE GRIP — 7740 <> 7760

IF 7740–7760 holds, THEN expect rotation around 7750.

The structure is still dampening.

Inside the grip, harvest faster. Don’t demand runners from a market actively fighting continuation.

IF > 7760, THEN 7775/7780 becomes the test.

Still close enough to the grip that rejection can rotate price straight back inside.

IF < 7740, THEN 7735 becomes the lower decision.

Lose that and the lower gamma zone begins coming into play.

ABOVE THE GRIP

IF > 7775/7780 and accepts, THEN 7795–7810 becomes live.

Price is above the top of today’s Expected Move and outside the primary grip.

That allows a quicker traverse toward the ATH area and the lower edge of the upper gamma structure.

7795–7810 is the next waypoint/reaction zone — not a destination.

IF 7795–7810 rejects, THEN 7780 becomes the first reverse-test, followed by 7775 and 7760.

There is not much structural inventory between the areas, so a failed extension can give ground back quickly.

IF price accepts through 7810, THEN 7820–7830 becomes live.

Now price is actually working into the upper gamma concentration.

That is a different statement from simply tagging 7800.

Ahead of CPI, make the bulls prove it.

BELOW THE GRIP

IF < 7740, THEN 7735.

Price is leaving the center.

IF < 7735, THEN 7725/7720.

That is the upper edge of the lower gamma zone and roughly today’s lower Expected Move.

IF 7720–7725 holds or reclaims, THEN 7735 and eventually 7740 become the reverse-tests.

That is the behavior the lower gamma structure is supposed to produce.

IF < 7720, THEN 7715 → 7705 through the lower gamma zone.

Do not treat every small break inside the zone as a new directional regime.

IF < 7705, THEN 7700 becomes the real test.

IF < 7700 and accepts, THEN 7690 → 7675.

Now the larger structure has changed.

Every THEN becomes the next IF.

💰 PREMIUM SELLERS

Distance matters.

The gamma sitting around that distance matters more.

📐 EXPECTED MOVE

1.0x EM: ~7720 <> 7780

1.5x EM: ~7705 <> 7795

The rails interact very differently with today’s gamma map.

🔻 PUT SIDE

The main downside gamma cushion sits around:

7705–7725

The 1.0x lower rail near 7720 lands inside the upper portion of that zone.

The 1.5x lower rail near 7705 reaches the lower end of the same structure.

That gives put sellers meaningful gamma between spot and the downside edge — but it is not unlimited protection.

7705–7725 intact: dealers can still dampen.

Acceptance below 7700: the environment has changed.

At that point, distance alone is no longer doing the work.

🔺 CALL SIDE

The 1.0x upper rail around 7780 sits at the upper transition, before the larger overhead gamma structure.

The 1.5x upper rail around 7795 lands at the ATH / first reaction area.

Above that sits the more substantial 7810–7830 upper gamma zone.

So the hierarchy is:

7780 — top of EM / permission

7795–7810 — waypoint / reaction

7810–7830 — upper gamma structure

A 1.5x call around 7795 is therefore not comfortably beyond the structure.

It sits where price can arrive if the upper EM breaks, before the stronger upper gamma zone has really had a chance to do its work.

🧠 PREMIUM TRADE MANAGEMENT

Inside 7740–7760, positive gamma still favors rotation.

Harvest faster.

Above 7775/7780, don’t automatically fade the first extension merely because price moved outside the Expected Move.

Below 7735, respect the path into the lower gamma zone.

Below 7700, short premium is no longer operating against the same dampening structure.

And anything carried past today’s close is no longer simply a Tuesday income trade.

It is a CPI position.

🧠 ADDITIONAL CONSIDERATIONS

THE FIRST EXTENSION IS NOT THE DECISION

A move through 7780 does not mean SPX is headed to 7830.

It means price has earned permission to test the next structure.

Likewise, a break of 7735 does not automatically mean 7700.

It means the lower gamma area becomes relevant.

REACTION IS NOT ACCEPTANCE

A wick through a level is information.

Sustained trade through it is different information.

Undercut/reclaim, rejection, and acceptance should not be treated as the same event.

TIME MATTERS TODAY

Tuesday’s 0DTE gamma disappears tonight.

CPI risk does not.

As the session gets later, tomorrow’s event can increasingly matter more than today’s expiring structure.

🧠 BOTTOM LINE

Four conditions define Tuesday.

Hold 7740–7760 → rotation remains the default.

Accept above 7775/7780 → 7795–7810 becomes the next reaction area.

Lose 7735/7740 → 7725–7705 becomes the lower structural zone.

Accept below 7700 → the larger downside character changes.

Everything else is navigation.

CPI gets the next real vote tomorrow morning.

The goat doesn’t jump the fence before he sees where the ground is.

📊 TRADINGVIEW STRINGS

MAIN

$SPX: change of character, 7700, positive gamma structure, 7705, reaction, 7725, downside trigger, 7735, control, 7740, axis, 7750, control, 7760, upside trigger, 7775, EM top, 7780, ATH rail, 7795, reaction, 7810, upper stretch, 7830

$ES1!: change of character, 7722.50, positive gamma structure, 7727.50, reaction, 7747.50, downside trigger, 7757.50, control, 7762.50, axis, 7772.50, control, 7782.50, upside trigger, 7797.50, EM top, 7802.50, ATH rail, 7817.50, reaction, 7832.50, upper stretch, 7852.50

$SPY: change of character, 770, positive gamma structure, 770.50, reaction, 772.50, downside trigger, 773.50, control, 774, axis, 775, control, 776, upside trigger, 777.50, EM top, 778, ATH rail, 779.50, reaction, 781, upper stretch, 783

SCALPER

$SPX: lower stretch, 7705, reaction, 7720, downside trigger, 7735, control, 7740, axis, 7750, control, 7760, upside trigger, 7775, EM top, 7780, ATH rail, 7795, reaction, 7810

$ES1!: lower stretch, 7727.50, reaction, 7742.50, downside trigger, 7757.50, control, 7762.50, axis, 7772.50, control, 7782.50, upside trigger, 7797.50, EM top, 7802.50, ATH rail, 7817.50, reaction, 7832.50

$SPY: lower stretch, 770.50, reaction, 772, downside trigger, 773.50, control, 774, axis, 775, control, 776, upside trigger, 777.50, EM top, 778, ATH rail, 779.50, reaction, 781

Scalper strings are built around the morning structure and should be re-anchored if price materially moves.

📋 CHEAT CARD

🔺 7810–7830 — upper gamma / reaction zone

7795 — ATH rail

7775–7780 — upside permission / upper EM

🎯 7740–7760 — control zone, 7750 axis

🔻 7720–7725 — lower EM / upper edge of lower gamma

🔻 7705 — lower edge of gamma zone

⚠️ 7700 — character line

📐 1.0x EM: ~7720 <> 7780
📐 1.5x EM: ~7705 <> 7795

🌪️ VIX under 16, VVIX firming

🗓️ CPI Wednesday, 8:30 AM ET

QUICK READ

Hold 7740–7760 = rotation.

Accept >7775/7780 = 7795–7810 becomes live.

Lose 7735/7740 = lower gamma zone comes into play.

Accept <7700 = larger downside character change.

Found this useful? Restack it or send it to someone who trades SPX.

Trade today’s market. Understand tomorrow’s.
Daily preparation. Lasting market education.

QUANTUITION — Analytics combined with Edge from Experience. 🐐

file_zgIPLAisRz1pv
file_tAMizNPrj2qyj
file_6yWWBUZx4LJ0I
file_2n0xS7FoczyVN
Profile picture
Doc McGrawProfile picture@doctradermcgraw·Aug 10

Doc’s SPX Daily Plan — Monday, August 10: CPI Week Opens With 7800 Overhead

The S&P 500 starts the week near 7750 with cheap volatility, negative gamma overhead, and the biggest position on the board sitting above the all-time high.

📺 Join me live at 8:30 AM ET:
YouTube Live
X/Twitter Live

🧭 CONTEXT

At 6:15 AM ET the S&P 500 is flat. Overnight ran a 30-point range, roughly 7740 to 7770, entirely inside Friday’s range.

Friday closed at 7757.64, up 0.82%, just above a cluster of dealer long positioning at 7750. Gamma zero sits with it. Above that line dealers dampen moves; below it they amplify them.

That makes 7750 a character line, not a magic number — and we’re sitting on the top edge of it.

🌪️ VIX is 15.5 overnight. Friday’s sub-15 print was a weekend mark — throw it out. Vol is still cheap, IV Rank in single digits, but the front end has already started firming before the data shows up.

Ten days ago the market was pricing a real chance of another rate hike. September odds sat at 55%. One soft jobs report knocked them to 42%, and the conversation flipped to when the Fed cuts.

Party on, Garth.

That’s the week’s tension. The market repriced calm fast, and now CPI Wednesday, PPI Thursday, and Retail Sales Friday each get a vote on whether that repricing holds.

Cheap vol isn’t bearish on its own. It means the cushion is thin if something challenges the story.

🛢️ Oil is another variable sitting under Wednesday’s CPI print. Iran headlines have been reversing, and energy is the loosest part of the inflation story right now.

A soft headline CPI driven mostly by energy tells us less than broad cooling in core, shelter, and services. Even a clean-looking headline number may need a second look.

Monday and Tuesday are positioning days.

You can’t trade the CPI number — nobody knows it yet. What you can control is how you’re set up when it prints.

🗓️ EVENTS & EARNINGS

Monday — BRK.B BMO

Tuesday — SMCI AMC

Wednesday — 8:30 AM ET July CPI · Weekly VIX expiration · NBIS BMO · CSCO AMC · CRWV AMC

Thursday — PPI · JD BMO · AMAT AMC

Friday — Retail Sales

Implied moves: NBIS 17% · CRWV 14% · SMCI 14% · AMAT 10% · CSCO 8%

⚠️ Wednesday is crowded — CPI, a weekly VIX expiry, and three of the AI infrastructure names on the same session. CPI is the main event. The expiry is a mechanical wrinkle.

The cohort runs all week: SMCI Tuesday, NBIS, CSCO and CRWV Wednesday, AMAT Thursday.

Individually these are earnings moves. What matters is whether they start resolving in the same direction. That read-through can move through semis and hyperscalers into SPX.

Watch what leads on any print. Cyclicals, financials, small caps, homebuilders. If the move is mega-cap only, it’s weaker than the index level suggests.

⚠️ A NOTE ON THE GAMMA SIGN

Worth clearing up, because it changes how you read everything below.

Most free gamma charts will show positive gamma above spot this morning. Ours shows negative.

That’s a sign convention, not a data conflict. Those services assume dealers are long whatever customers buy. On our board, customers are long the calls overhead, which puts dealers short them.

Long gamma creates dampening, mean-reverting pressure. Short gamma creates amplifying, pro-cyclical hedging.

Negative gamma isn’t inherently downside. Dealers hedge with the move, whichever direction price is traveling.

Today that structure is overhead.

🔄 If this is useful, pass it along. Most people trading SPX have never checked which way their gamma chart is signed.

📏 LEVELS & LINES — THE PLAYING FIELD

The three-day box: 7700 to 7795.

Wednesday’s open made the all-time high just under 7795 and never went back. The low came in just under 7700.

Two sessions of digestion since. Friday tightened it further — 7720 to 7765 — and closed at the top.

🎯 7750 — the axis. Dealer long cluster with gamma zero sitting on it. Character line and center of gravity.

🧱 7765 — the near ceiling. Friday’s high and the top of the recent chop.

7765 to 7795 — thin. Little structural inventory through here. That stretch ends where the contested upper zone begins.

📦 7720–7725 — the near floor. Positive gamma at 7725, Friday’s low at 7720, tested twice and held both times.

📦 7700 — the real floor. Second gamma-zero area and the bottom of the three-day range. Lose it and hedging becomes more amplifying.

⚠️ 7690–7675 — downside extension. Below 7700, 7690 is the first lower waypoint. The broader change-of-character area sits near 7675.

📐 THE RAILS

8/10 Monday 0DTE
EM/Straddle: 29.70 · Ref. SPX 7765
7735 <> 7795

8/12 Wednesday CPI
EM/Straddle: 65.40 · Ref. SPX 7760
7695 <> 7825

8/14 Friday
EM/Straddle: 88.35 · Ref. SPX 7760
7670 <> 7850

8/21 Friday Aug OPEX
EM/Straddle: 130.50 · Ref. SPX 7765
7635 <> 7895

Rails decay all session. This is the open, not a level that holds.

🔥 Above the near ceiling, the structure changes. The stretch from 7795 through 7830 is contested — long and short inventory alternate, so hedging can flip direction every few points.

The largest position on the board sits inside it at 7800, above the all-time high, and dealers are short it.

A rail tells you distance. Structure tells you what happens on arrival.

Where the two overlap, the reference becomes more useful. Today those overlaps are clean on one side and not the other.

💰 New this week: a dedicated SPX premium sellers section. Iron condor and credit spread sellers get their own read on where distance and structure actually line up.

Today, one side of the board has a clean overlap. The other doesn’t.

That section runs below, after the Road Map.

Everything above is the playing field. Below is how to navigate it — the deeper gamma read overhead, the volatility and positioning frame heading into CPI, the complete IF/THEN Road Map, Premium Sellers, and today’s TradingView strings.

Subscribe to get the full plan every morning before the open.

PAYWALL

⚠️ VOLATILITY & POSITIONING

Two engines got us here. One has mostly run its course.

🌪️ The vol crush is mostly spent. VIX traveled from 19–20 down toward 15 as the forced seller left and front-end protection came off.

From 15.5 there’s no comparable reservoir left to unwind. Whatever moves the tape this week has to come from somewhere else.

🚀 The upside positioning is still live. Dealers remain short call gamma above spot, and those hedges were rolled higher through the rally rather than taken off.

More of that book sits in September than expires this Friday, giving the structure a longer runway.

🔀 Correlation is the variable to watch. Low correlation has been the cushion — names cancel each other out and the index goes nowhere.

A common macro shock can make them move together again. That gives SPX real range in either direction.

🌡️ VVIX is the unresolved tell. It rose while VIX and VIX9D fell. Watch Monday and Tuesday rather than forcing an interpretation.

Negative gamma remains overhead into Wednesday, with 7800 the main upper strike and positive gamma building underneath near 7700.

That matters because CPI is landing directly into a structure that can amplify the move. If price pushes higher, dealer hedging can add fuel rather than fight it.

Below 7700, the board changes again. 7690 is the first lower waypoint, with the broader change-of-character area near 7675.

🌪️ VIX

Wednesday’s expiration is the weekly.

The monthly is August 19.

The structure worth watching sits at 17–17.5, and the August 19 monthly book shows a similar distribution. That gives the area more weight than this week’s expiry alone.

Under 17.5, a CPI washout can still behave like a tradable dip.

Above 17.5 and holding, the tape changes character.

📏 LEVELS & LINES — THE FULL READ

🔥 THE UPPER STRUCTURE

7795–7830 — contested.

Dealers long at 7795, 7810, 7825. Short at 7800, 7805, 7815, 7820.

Hedging flips direction every few points, which is why this stretch can chop instead of trend cleanly.

7800 — the largest short-gamma strike on the board, embedded inside that contested inventory.

Think movie, not snapshot.

The approach can accelerate because dealers hedge with price.

First contact can still produce exhaustion or rotation.

Acceptance through the surrounding structure can turn the same positioning into fuel.

7830 — first clean positive gamma above it. The next cleaner structure.

🎯 WHERE DISTANCE AND STRUCTURE OVERLAP

Monday 1.0x upper at 7795 — the all-time high, the long strike at 7795, and the rail all in the same place, sitting right under the 7800 short.

The strongest confluence on the board today.

Monday 1.5x lower at 7720 — Friday’s low, just under the 7725 positive gamma, already tested twice.

Monday 1.0x lower at 7735 — distance without useful structure. Open ground between the axis and the 7725 shelf.

Monday 1.5x upper at 7810 — distance landing inside contested inventory, past the 7800 short rather than before it.

Acceptance through any of these is information too. A reference getting taken out tells you something the reference holding does not.

🗓️ HIGHER TIMEFRAME

Wednesday’s 7695 rail lands directly in the 7690–7700 lower transition area. CPI’s downside rail and the lower structural change are essentially meeting in the same neighborhood.

Wednesday’s 7825 rail stops at the top of the contested stretch, just under the 7830 positive-gamma structure.

Friday’s 7670 rail sits near the broader 7675 change-of-character area. That is a Friday-to-Friday reference, not a Monday 0DTE level.

🗺️ SPX ROAD MAP 0DTE

CHOP ZONE — 7735 to 7765

IF > 7765, THEN 7775 first, then 7785

IF > 7785, THEN 7795 into the all-time high and the 1.0x rail

IF < 7750, THEN back to 7740

IF < 7735, THEN 7725

IF 7735 reclaims from below, THEN back to the axis at 7750

ABOVE CHOP

IF > 7795, THEN 7800 with hedging moving with price

IF accepts above 7805, THEN 7810, then 7820

IF > 7830, THEN structure thins above

IF 7800 rejects, THEN 7790, then 7775

IF < 7785 after tagging above, THEN failed extension, back to 7765

IF < 7765 from above, THEN the chop zone reabsorbs it

BELOW CHOP

IF < 7725, THEN 7720 and Friday’s low

IF < 7715, THEN 7705, then 7700

IF < 7700, THEN amplification territory, 7690 next

IF < 7690, THEN 7680, then 7675

IF < 7675, THEN the lower structure has changed and the Friday 7670 rail is live

IF 7725 reclaims from below, THEN 7735

IF 7750 reclaims from below, THEN the axis is back and 7765 is live

💰 PREMIUM SELLERS

📐 RAILS FIRST

1.0x → 7735 <> 7795
1.5x → 7720 <> 7810
2.0x → 7705 <> 7825

⚠️ One caution before the levels.

Gamma thins below 7750. The strikes at 7715, 7720 and 7725 are real but small. The heavier structure sits at the axis, overhead, and again near 7700.

Don’t overread thin structure.

📉 PUT SIDE

1.5x at 7720 lands on Friday’s low with positive gamma nearby.

Distance and price memory agree, and the level was tested twice last week — but the gamma piece is light, so lean more heavily on price behavior.

At 2.0x near 7705, you are approaching the lower character area rather than simply adding more distance.

The useful structure is 7700, with 7690–7675 underneath if that floor fails.

📈 CALL SIDE

1.0x at 7795 sits under the largest short strike on the board, with long inventory at 7795 itself.

That’s the cleanest reference on the board today and the place where distance and real size line up best.

1.5x at 7810 clears 7800 but lands inside contested inventory where hedging flips direction every few points.

2.0x at 7825 sits on long inventory just under 7830 — better structure, but two expected moves out on a day with cheap premium.

🧠 THE REAL ISSUE

The problem today isn’t the map. It’s the premium.

IV Rank is in single digits and the 0DTE straddle is under 30 handles.

The board gives you references. The chain isn’t paying much to use them.

Sometimes the best premium trade is recognizing you’re not being paid enough to sell it.

⚠️ What invalidates the premise: acceptance through 7800 on the call side, or losing 7700 on the put side.

Below 7700, the trade is no longer leaning on the same structure.

Distance alone was never the protection.

🧠 BOTTOM LINE

We open flat, sitting on the top edge of the axis, inside a three-day box that hasn’t decided anything.

The thing worth carrying all day is what’s overhead.

The largest position on the board sits at 7800, above the all-time high, and dealers are short it.

That’s an unusual place for the biggest structure to live. The approach can accelerate rather than stall — and first contact still isn’t the whole story.

Below, structure thins under 7750 before firming again near 7700.

And 7700 is not the bottom of the map. Lose it and the next path runs through 7690 toward the broader 7675 change-of-character area.

Two positioning days before CPI lands into a tape that can amplify whatever it says.

Watch which side of the axis we operate from, and don’t confuse a fast traverse for a decision.

📊 TRADINGVIEW STRINGS

MAIN

$SPX: change of character, 7675, downside trigger, 7690, real floor, 7700, near floor, 7725, chop low, 7735, axis, 7750, chop high, 7765, ATH rail, 7795, short gamma, 7800, positive gamma structure, 7830

$ES1!: change of character, 7698, downside trigger, 7713, real floor, 7723, near floor, 7748, chop low, 7758, axis, 7773, chop high, 7788, ATH rail, 7818, short gamma, 7823, positive gamma structure, 7853

$SPY: change of character, 765.5, downside trigger, 767, real floor, 768, near floor, 771, chop low, 772, axis, 773, chop high, 774.5, ATH rail, 777.5, short gamma, 778, positive gamma structure, 781

SCALPER

$SPX: downside trigger, 7690, real floor, 7700, near floor, 7725, first catch, 7740, axis, 7750, chop high, 7765, thin, 7770, reaction, 7785, ATH rail, 7795, accel trigger, 7800, contested, 7810, contested upper, 7820

$ES1!: downside trigger, 7713, real floor, 7723, near floor, 7748, first catch, 7763, axis, 7773, chop high, 7788, thin, 7793, reaction, 7808, ATH rail, 7818, accel trigger, 7823, contested, 7833, contested upper, 7843

$SPY: downside trigger, 767, real floor, 768, near floor, 771, first catch, 771.5, axis, 773, chop high, 774.5, thin, 775, reaction, 776.5, ATH rail, 777.5, accel trigger, 778, contested, 779, contested upper, 780

Scalper strings are built off spot and go stale after a full expected move. Re-anchor if price travels.

📋 CHEAT CARD

SPX 0DTE — MONDAY, AUGUST 10

🎯 AXIS 7750 — dampen above, amplify below
📦 CHOP 7735 to 7765
🧱 NEAR CEILING 7765 — thin path to 7795 above it
📦 NEAR FLOOR 7720 to 7725 — light structure, tested twice Friday
📦 REAL FLOOR 7700 — lower character line
⚠️ DOWNSIDE TRIGGER 7690 — amplification continues below
⚠️ CHANGE OF CHARACTER 7675 — broader downside threshold
🔥 CONTESTED 7795 to 7830 — inventory alternating
SHORT GAMMA 7800 — largest on the board, above the ATH
🧱 POSITIVE GAMMA STRUCTURE 7830

📐 EM 0DTE 7735 to 7795
📐 1.5x 7720 to 7810
📐 2.0x 7705 to 7825

🗓️ CPI Wednesday 8:30 AM ET
🗓️ PPI Thursday
🗓️ Retail Sales Friday
🌪️ VIX 15.5 — watch 17.5

Structure tells you why. Levels tell you where. The Road Map tells you how to navigate it.

🔄 If today’s read helped, restack it or send it to someone who trades SPX.

QUANTUITION — Analytics + Edge from Experience. 🐐
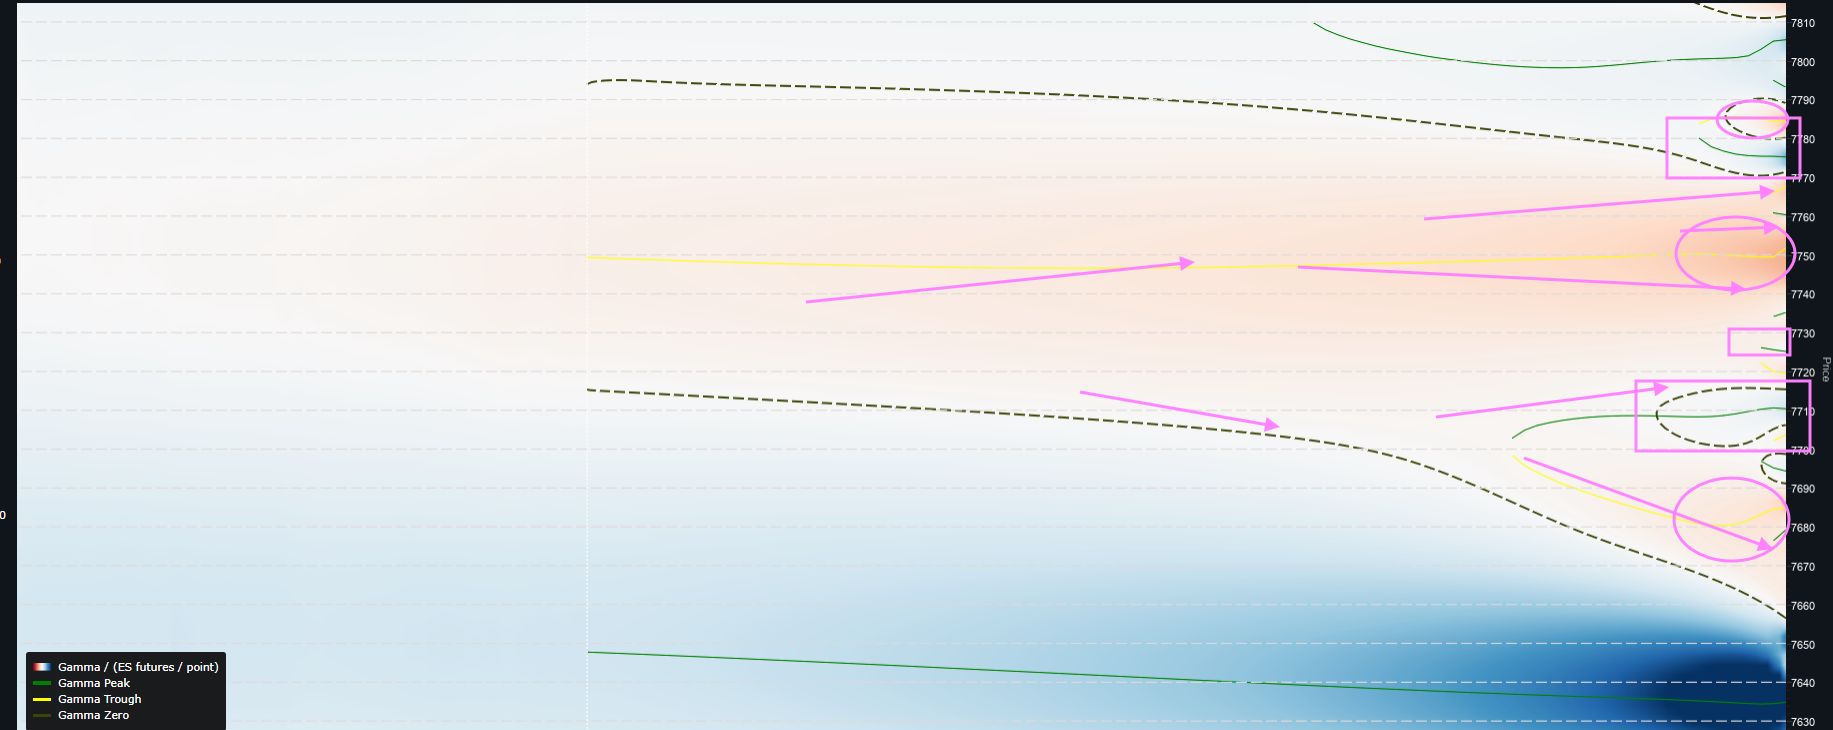
file_WnYfBpRrUGyT1
file_uOzSvLh6mit0b
file_y91Nxmjm2XeJU
Profile picture
Doc McGrawProfile picture@doctradermcgraw·Aug 6

🧭 Doc McGraw's SPX 0DTE Daily Plan — Thursday, August 6

Claims Day, Payrolls Eve: Cheap Vol, No Cushion, Short Gamma Both Ways

The tape is priced for a nothing day. IV Rank sits at 13.5%, correlation is near historic lows, and dealers are short gamma across the entire working range. Today is the setup. Tomorrow is the test.

👀 TODAY AT A GLANCE

📈 Context: Quiet overnight, SPX near 7737 after Wednesday closed on its low. Everything is waiting for Friday.

📅 Drivers: Jobless Claims, the Big Dog $DDOG before the bell, $NET after, and the reaction to last night's $SNDK and $WDC prints.

📍 Structure: SPX ref near 7737. 0DTE EM 7690–7760. Chop Zone 7700–7760.

🌪️ Volatility: IV Rank 13.5%. COR1M at 7.08. Dispersion deflating everywhere at once.

🗺️ Plan: Trade the reaction, not the prediction.

📈 CONTEXT

Wednesday's close told you nothing. The session told you everything.

SPX finished 7723.55, down 0.17%. Sounds like a rest day. It wasn't. The market opened 7771.62, printed its high at 7793.68 inside the first five minutes, then walked downhill for six and a half hours to close on the low at 7720.17. Open at the top, close at the bottom, seventy-three points of one-way bleed dressed up as a flat tape.

QQQ closed off 0.90%, sitting on the low of the day. IWM off 0.84%, also on the low. When both of them close on the low, nobody wanted to carry inventory overnight.

Underneath, though, the damage was concentrated. RSP — the equal weight — lost a quarter of a percent. MAGS actually beat QQQ, down 0.78%, and it's still holding its 200-day. SMH off 1.04%, IGV off 0.68%. The average stock had a nothing day. A couple of large names did all the work.

Overnight has been quiet. SPX is near 7737 as of 6:30 AM ET, up fractionally — call it basically unchanged — after chopping between roughly 7719 and 7748 all session. VIX is hovering near 16. Crude is fractionally above 75.

All the main drivers are in a holding pattern.

🌪️ The volatility subplot

Three things worth carrying into the open.

Options Dashboard has IV Rank at 13.5% this morning. That's the floor of the one-year range. Cheap vol into a jobs number is always worth noticing.

Everything that got stretched in July is deflating at once — dispersion, constituent vol, Nasdaq vol, all of it. Earnings season did that, and it did it quietly. No gap, no spike. It just leaked out.

And COR1M — one-month implied correlation — sits at 7.08. Near historic lows. That's why GOOGL can drop four percent, NVDA can rip three and a half, and the index closes down 0.17%.

Low correlation is a cushion. It's also fuel. Which one it turns out to be gets decided tomorrow at 8:30, not today.

The full volatility and positioning frame is below the paywall.

📅 EVENTS & EARNINGS

Thursday, August 6

8:30 AM ET — Initial Jobless Claims and Continuing Claims. Not the main event. But the tape will sniff it for any crack in the labor market before tomorrow's real exam.

📊 Reported last night — $SNDK and $WDC. Both beat. Both got sold anyway. Storage and semis under the microscope at the open.

📊 Before the open — the Big Dog, $DDOG, with $HAE and $OSCR tagging along.

📊 After the close — $NET is the marquee. Also $AAOI, $CRSR, $DBX, $FROG, $HALO, $ROKU.

Friday, August 7

🎯 The Employment Report. That's the forcing function. Everything today is just clearing its throat.

👀 What I'm watching

Whether good news keeps getting sold the way $SNDK and $WDC got sold

Whether VIX9D wakes up or keeps napping into the print

Whether COR1M closes back above 8

Whether 7700 can hold without help

📍 LEVELS & LINES — PREVIEW

Reference: SPX near 7737

08/06/26: EM/Straddle: 35.00 — ref. SPX 7725 → 7690 <> 7760 Thu

The straddle came in from 43.95 at last night's pull to about 35 this morning. Call it 50 points either side to reasonably contain the day's range.

Stretch references:

1.5x EM: 7675–7775
2x EM: 7655–7795

Wednesday's range was 7720–7794. Overnight has been 7719–7748.

A few areas stand out this morning:

7700 below — the largest single position on the board

7725 — prior close and straddle strike

7760 — top of today's expected move

7770 and 7780 — a defined structure that behaves very differently at each end

7655 — zero gamma

7640 area — heavier support

That doesn't mean SPX goes to any of them. It means today's path is conditional. Clear a level and the next zone opens. Reject it, or clear it and fall back inside, and the tape usually reverse-tests.

There's one more thing on this map that most people will miss, and it's a timing issue rather than a level. Some of today's downside protection isn't installed yet. It shows up on the clock, not on the chart.

Below the paywall: the full structure, the volatility frame, today's IF/THEN Road Map, and both TradingView string sets.

🔒 Paid Members Continue Below

Subscribe to trade the market with a map instead of reacting to candles after the fact.

📍 LEVELS & LINES

Dealers are short gamma across the entire working range this morning — roughly −150 per point near spot. There is no positive-gamma pocket anywhere between 7660 and 7900.

That's the single most important fact on the board today. What it means in practice: moves get amplified rather than absorbed. There's no natural brake in the middle of the range. The book has to press whichever way the tape leans.

The 7770 / 7780 structure. Somebody owns a call debit spread up there. That leaves the dealer short the 7770 calls and long the 7780s. So the dealer has to buy into 7770 and stops buying at 7780. Ignition, then wall, ten points apart. Don't treat a run at 7770 as a rejection zone. Treat it as an accelerant into a cap.

7700 is the biggest position on the board. Customer long puts, dealer short roughly four thousand. Same mechanic pointed the other way — the dealer sells into weakness there. On the heat map it's the deepest negative pocket of the day, and it gets deeper into the close as charm burns the contracts down.

7655 to 7660 is zero gamma and it runs flat all session. Above it, amplification. Below it, dealer length takes over and the tape turns sticky in the 7640s.

The timing wrinkle. The dealer-long pockets at 7720 and 7680 aren't there yet. They begin forming around 1:30 PM and firm into the close. That matters more than it sounds. A break of 7725 at 10:00 AM travels through open air. The same break at 2:00 PM has a cushion under it. Morning breaks run further than afternoon breaks today.

Resistance: 7750 → 7760 → 7770 → 7780 → 7800
Support: 7725 → 7710 → 7700 → 7690 → 7680 → 7655 → 7640

🌪️ VOLATILITY & POSITIONING

Dispersion is deflating. All of July, single stocks were priced to move a lot more than the index. That's not a retail crowd trade — that's the vol desks, long single-name vol against short index vol, and they got paid on it. Now it's coming off, and it's coming off everywhere at once: the dispersion index, constituent vol, Nasdaq vol, the Nasdaq-to-VIX ratio. Four different windows on the same position, all pointed the same way. Nothing broke and nothing spiked. It just leaked out. That's not coincidence, that's a mechanism. DSPX 40.55 from roughly 48. VIXEQ 43.48 from roughly 51. VXN 24.15, down 5.22%. VXN/VIX 1.52 from 1.75.

Earnings did it. Hotel room on race weekend — you pay triple, and Monday the rate goes back to normal. Nothing broke. The reason to pay up expired. Single-stock vol works exactly the same way. It carries an event premium only while the print is still in front of you. With 85 to 95% of index market cap reported, that premium has nowhere left to sit. The dispersion trade isn't blowing up. It's expiring.

Except NVDA hasn't printed. Roughly 7.5% of the index, and it doesn't report until 8/26 after the close. Every other name over 1% weight is through. So the whole book has been de-premiumed except its single largest position. You can't close a trade when the biggest leg still has an unpriced event in front of it. That's the difference between repaired and improving.

Correlation is the real story. COR1M sits at 7.08, near historic lows and barely moving while everything else compresses. That's why GOOGL can drop four percent, NVDA can rip three and a half, and the index closes down 0.17%. The components keep offsetting each other. Real cushion. Thin cushion.

IV Rank is on the floor. Options Dashboard has it at 13.5% this morning, with IV Percentile at 21.8% as of yesterday's close — bottom of the range on both, and the fourth trip down there since May. Every visit since March ended the same way: a snap back toward 60-plus inside a couple of weeks. That's not a timing signal. It's a statement about what you're being paid to sell. Right now, not much.

The front end says today is quiet. VIX 15.92, VIX1D 12.15. The VIX−VIX9D spread is 2.13, above its 1.53 average — normal contango, front end cheap. Claims at 8:30 isn't the event. Payrolls is.

Watch checklist

  1. Does VIX9D lift after claims, or stay near 13?

  2. Does COR1M close back above 8?

  3. Does VVIX confirm any VIX move, or diverge the way it did Wednesday?

  4. Does the dispersion compression continue, or stall ahead of NVDA?

  5. Does 7700 hold on a first touch, or does it need a second?

Bottom line: low correlation is fuel, not comfort. Stack it on a dealer book short gamma at both wings with a jobs number twenty-four hours out, and Thursday's quiet is rented. Not owned.

🗺️ $SPX ROAD MAP 0DTE

Trade the reaction, not the prediction.

CHOP ZONE: 7700–7760

Reference: SPX near 7737
0DTE Expected Move: 7690–7760

IF SPX pushes higher from current trade,
THEN 7750 becomes the first upside reaction — thin, no dealer length there to slow it.

IF SPX clears 7750,
THEN 7760 becomes the top-of-chop / EM-top reaction zone.

IF SPX rejects 7750,
THEN look for a reverse-test back toward 7725–7730, where the straddle strike sits.

IF SPX loses 7725,
THEN 7710 becomes the next downside reaction — open air until the afternoon.

IF SPX loses 7710,
THEN 7700 becomes the bottom-of-chop reaction zone. Dealers are short puts here and sell into it.

IF SPX undercuts 7700 and reclaims,
THEN that can produce a reversal back toward 7725–7740. The hedging is done and the pressure comes off.

ABOVE CHOP

IF SPX clears 7760,
THEN 7770 becomes the next upside reaction. Dealers are short calls here and have to buy — this is ignition, not resistance.

IF SPX rejects 7770,
THEN look for a reverse-test of 7760.

IF SPX clears 7770,
THEN 7775–7780 becomes the 1.5x EM and upper cap zone. Dealers are long at 7780 and the buying stops there.

IF SPX rejects 7780,
THEN look for a reverse-test back toward 7760–7770.

IF SPX clears 7780,
THEN 7795–7800 becomes the 2x EM stretch. Above the cap the structure is spent and the tape is unmanaged.

BELOW CHOP

IF SPX loses 7700,
THEN 7690 becomes the 0DTE EM-bottom test.

IF SPX loses 7690,
THEN 7680 becomes the next downside reaction — dealer length builds here, but not until after 1:30.

IF SPX rejects or reclaims 7680,
THEN look for a reverse-test back toward 7700.

IF SPX loses 7680,
THEN 7675 becomes the 1.5x EM marker.

IF SPX loses 7675,
THEN 7655 becomes the zero-gamma reaction zone. Below it, the amplification stops.

IF SPX loses 7655,
THEN 7640 becomes the larger support area, where dealer length turns the tape sticky again.

📌 ADDITIONAL CONSIDERATIONS

The clock matters today. The dealer-long pockets at 7720 and 7680 don't form until roughly 1:30 PM. A morning break of 7725 travels through open air. The same break after lunch has a cushion underneath it. Size the downside differently before and after midday.

🎯 7770 and 7780 are not the same kind of level. One is an accelerant, one is a cap, and they're ten points apart. Getting that backwards is how people get run over on the way up.

📉 7700 is the day's fulcrum. Largest position on the board, deepest negative pocket, and it deepens into the close. A clean first-touch hold means the hedging is complete and price snaps back. A second test usually doesn't hold.

🌪️ Vol is cheap and correlation is on the floor. That's not a prediction. It's a description of how little cushion there is if tomorrow's number surprises.

📅 Nothing today is the event. Claims is a temperature check. The tape is saving itself for Friday, and the front-end pricing says so plainly.

🐐 Bottom line: Short gamma everywhere, no brake until the afternoon, cheap protection, and a jobs number one sleep away. Quiet is the base case. Fast is the risk.

💰 A NOTE FOR PREMIUM SELLERS

The premium-selling frame is wider than the Chop Zone.

The two negative-gamma engines sit at 7700 below and 7770 above. Those are not comfortable places to sell close against. Dealer hedging can amplify movement as price approaches them, particularly while the book remains short gamma.

On the call side, 7800 is the first reasonable reference beyond the 7770–7780 structure, with 7825 behind it as the larger node.

On the put side, the cleaner structural reference sits below 7655 zero gamma. Strikes at 7675 or higher remain inside the amplification zone, with limited morning structure below 7700 and the dealer-long pockets near 7720 and 7680 not developing until roughly 1:30 PM.

Do not force symmetry in distance, credit, delta, or contract count. Equal-credit hunting can pull the put side upward into the weakest part of the map. Less credit with better placement is still better placement.

IV Rank near 13.5% means premium is cheap while dealers remain short gamma across the working range. That argues for smaller size and wider judgment, not tighter strikes to manufacture yield.

Sometimes the best premium trade is recognizing that you are not being paid enough to sell it.

📋 CHEAT CARD

🟨 CHOP ZONE: 7700–7760

🎯 Reference: SPX near 7737
⚔️ Pivot: 7725
🚪 EM Top: 7760

⬆️ Above 7760: 7770 → 7780 → 7800
⬇️ Below 7700: 7690 → 7680 → 7655 → 7640

🌪️ 0DTE EM: 7690–7760
📏 1.5x EM: 7675–7775
📏 2x EM: 7655–7795

👀 First Vol Tell:
Does VIX9D wake up after claims, or stay asleep near 13?

🐐 Bottom Line:
Cheap vol. Floor-level correlation. Dealers short gamma both ways. Today is the setup. Friday is the test.

📺 TRADINGVIEW STRINGS

Two sets. They do different jobs.

The MAIN string is the day's map — structure, expected-move rails, gamma pockets, and the levels that define where the session can travel. Load it once. It holds all day.

The SCALPER string is tighter and behavioral. Every label tells you what dealers do at that level, not merely what the level is called. It is built around spot as of 6:30 AM, which means it is honest for the morning and goes stale as price travels. If SPX moves a full expected move in either direction, the scalper string is describing a neighborhood you have already left. The main string still works. The scalper string does not follow you.

MAIN

$SPX: support, 7640, zero gamma, 7655, 1.5x EM, 7675, dealer pocket, 7680, EM bot, 7690, big put, 7700, reaction, 7710, prior close, 7725, reaction, 7740, reaction, 7750, EM top, 7760, hot pocket, 7770, cap, 7780, 2x EM round, 7800, big node, 7825, top, 7845

$ES1!: support, 7665, zero gamma, 7680, 1.5x EM, 7700, dealer pocket, 7705, EM bot, 7715, big put, 7725, reaction, 7735, prior close, 7750, reaction, 7765, reaction, 7775, EM top, 7785, hot pocket, 7795, cap, 7805, 2x EM round, 7825, big node, 7850, top, 7870

$SPY: support, 761.7, zero gamma, 763.2, 1.5x EM, 765.2, dealer pocket, 765.7, EM bot, 766.7, big put, 767.7, reaction, 768.7, prior close, 770.2, reaction, 771.7, reaction, 772.7, EM top, 773.7, hot pocket, 774.7, cap, 775.7, 2x EM round, 777.7, big node, 780.2, top, 782.2

SCALPER

$SPX: first catch, 7690, dealer short, 7700, thin, 7710, overnight low, 7720, pivot, 7725, chop top, 7740, fade, 7750, rail, 7760, ignite, 7770, wall, 7780

$ES1!: first catch, 7715, dealer short, 7725, thin, 7735, overnight low, 7745, pivot, 7750, chop top, 7765, fade, 7775, rail, 7785, ignite, 7795, wall, 7805

$SPY: first catch, 766.7, dealer short, 767.7, thin, 768.7, overnight low, 769.7, pivot, 770.2, chop top, 771.7, fade, 772.7, rail, 773.7, ignite, 774.7, wall, 775.7

Reading the scalper labels

overnight low — the level the tape defended overnight

pivot — prior close and straddle strike, where price may keep returning

thin — no dealer length here this morning; moves can travel further than they should

dealer short — dealers short puts, with hedging pressure increasing into weakness

first catch — first real structure below

chop top — upper edge of the morning range

fade — little overhead structure to slow a push

rail — expected-move edge

ignite — dealers short calls; they buy into it and movement can accelerate

wall — dealers long; the buying pressure stops here

⚠️ Thin and dealer short are morning conditions only. Dealer length builds at 7720 and 7680 around 1:30 PM. After that, the downside firms considerably. The string will not tell you when. The clock will.

QUANTUITION — Analytics + Edge from Experience. 🐐
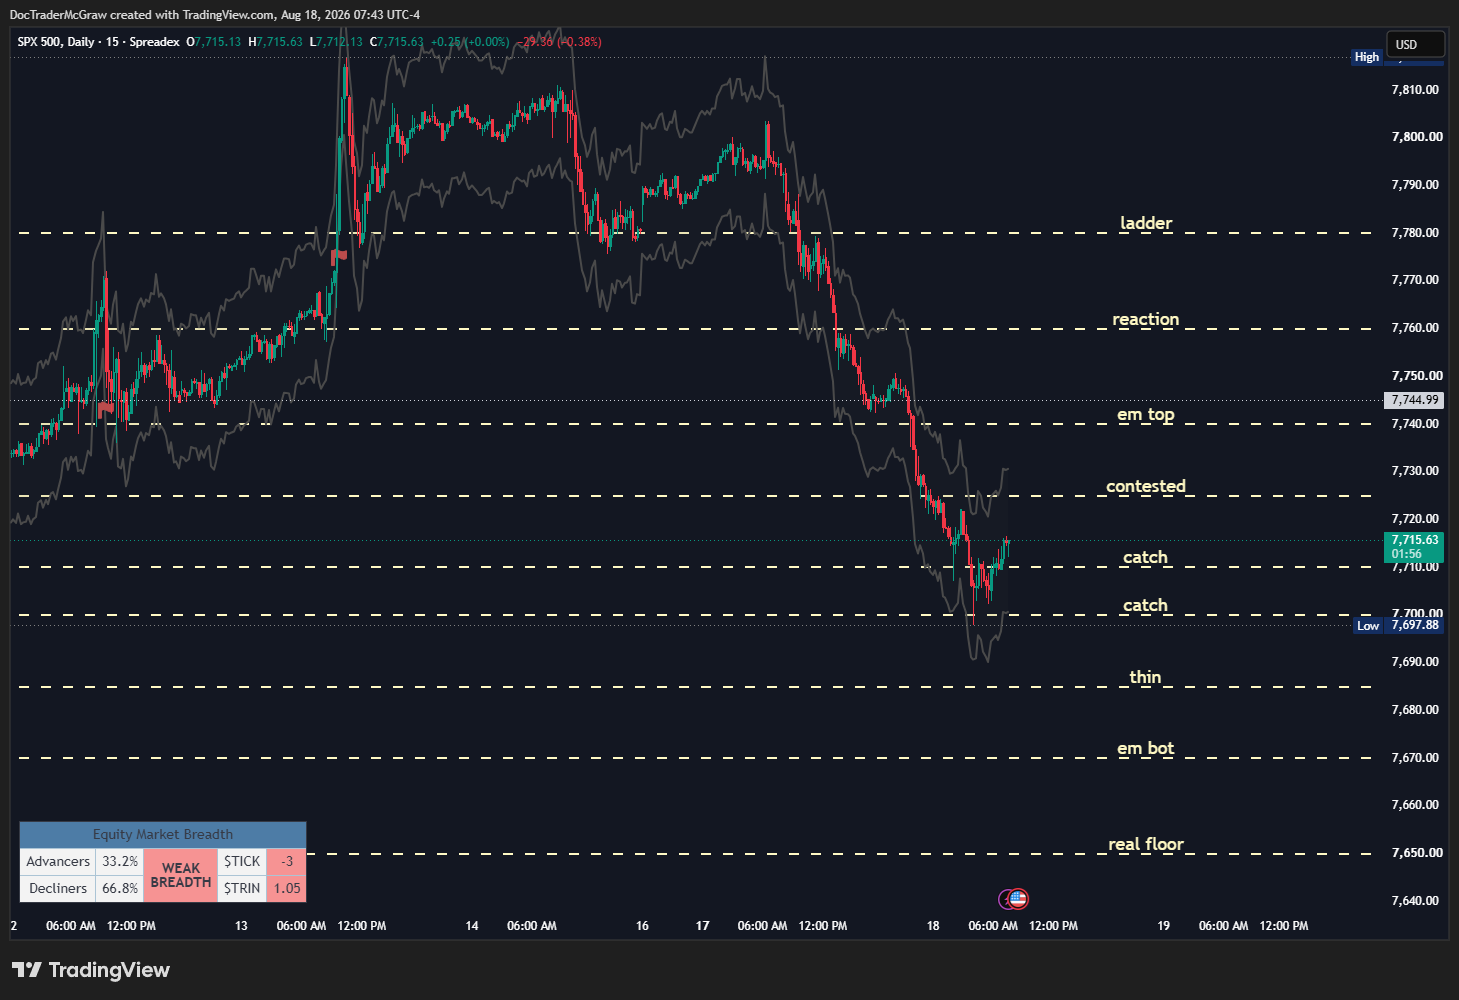
file_AQiWh1ySaVitK
file_P2oU0jLI4R8Uz
file_5FS1MzIf5kb58
file_XFQLafMtb06Tx
Profile picture
Doc McGrawProfile picture@doctradermcgraw·Jul 29

# THE S&P GAINED 0.2%. NOTHING ABOUT IT WAS CALM.

Fed at 2:00. Warsh at 2:30. The M brothers after the close. And market makers are short gamma on both sides of the tape.

Join me live at 8:30 AM ET:

YouTube Live

X/Twitter Live

📊 $SPX gained 0.24%. Equal-weight ripped 1.1%. Semis fell more than 4%. Those were the same session.

🧬 The hyperscalers versus enablers story keeps evolving. $MAGS and $IGV finished green, semis were hit again but closed off their lows, and memory/storage earnings added another mostly constructive set of headline numbers this morning.

🌡️ Today the unknown has a clock on it. IV has every reason to stay bid into 2:00. After the Fed becomes known, that event premium can come out quickly — but the M brothers and the rest of tonight’s AI stack are standing right behind it.

🎯 $SPX has tested the 7400 neighborhood four times recently and closed back above it every time. Today’s 0DTE rails are 7365 ↔ 7485.

Trade today’s market. Understand tomorrow’s.

Daily preparation. Lasting market education.

🔁 If this helps you read what is happening underneath the index, share or restack it. Somebody else is looking at the same candles and seeing a much calmer market than the one actually trading.

### 🗺️ TODAY’S MAP

▪️ CONTEXT — Green index, violent rotation underneath

▪️ EVENTS & EARNINGS — Fed → Warsh → the M brothers

▪️ LEVELS & LINES — 7400 survives again; 7435–7465 is today’s immediate box

▪️ VOL & ROAD MAP — Pre-Fed chop, post-Fed expansion, and short gamma both ways

---

## 🧭 CONTEXT

Yesterday is where the story actually is.

$SPX opened 7394, traded as low as 7383 and as high as 7452, then closed 7428.78. Sixty-nine handles of range, roughly 0.9% of travel, to finish up about a quarter percent.

The tape worked all day and got paid almost nothing for it.

📊 Two different markets traded inside the same session. Equal-weight gained 1.1% while semis fell more than 4%. $MAGS and $IGV were green. Semis were ugly, but they also recovered from the worst of the session.

The index you watch and the market you own are not always the same animal. Yesterday the difference was wide enough to fall into.

When the generals get shot and the index still closes green, the troops are doing some carrying. Breadth is a beautiful thing — right up until you ask it to hold the whole line by itself.

🧬 That cancellation has a name and a trade behind it: dispersion. Components can tear each other apart while the index sits relatively still. Short correlation. Long chaos underneath.

Memory/storage names added another piece this morning. Most of the headline results I saw were better than expectations. I care less about declaring the semi story fixed than I do about how the tape reacts. The hyperscalers versus enablers narrative is still being written one earnings report at a time.

🌙 Overnight started constructive. $SPX pushed into the 7460s after trading around 7410 earlier, then settled back near 7443. By about 8:15 AM the early bid had faded and the tape slipped back toward flat to slightly negative versus Tuesday’s close.

On FOMC day, that premarket wiggle gets about three grains of salt.

📉 The vol complex repaired Tuesday. $VIX9D moved back under $VIX after Monday’s brief inversion. Repaired, not comfortable.

And today changes the clock.

IV should have a reason to stay bid while the Fed is still unknown. That means 0DTE premium sellers may get plenty of chop without getting paid much theta for sitting through it. Event variance is still parked in the chain.

Once 2:00 arrives and the unknown becomes known, that specific Fed premium can come out fast.

But don’t confuse vol crush with price stability.

Market makers are broadly short gamma above and below current price. If the Fed produces a real directional impulse, hedging can reinforce the move. And because the strike map is another two-way fishbone, the first move can hit a rung, fail, reverse and then accelerate the other way.

That is FOMC.

Then the next event is already waiting.

$MSFT and $META report after the close, joined by another AI/semi slate, and Thursday morning brings GDP and PCE. So I’m looking for a Fed vol release after 2:00 — not assuming every piece of event premium simply disappears from the curve.

🔌 Oil is giving us the other side of the story. WTI just had its largest three-day decline since 2020 and is still up roughly 20% for July.

Both things can be true.

War premium is bleeding out of crude while anxiety premium keeps moving around inside technology.

Risk didn’t leave the building.

It changed rooms.

🧭 And then there is 7400.

Four recent tests around that neighborhood. Tuesday’s 7383 was the deepest poke. Every one closed back above.

Overhead, 7485–7500 contains today’s EM top, Monday’s 7489 high and the round number.

That is the larger box.

Before 2:00, this is mostly a sit-on-my-hands day for me — or a scalp day if the tape gives clean locations. I do not need to trade boredom just because the market is open.

After 2:00, the map matters more than the opinion.

---

## 📅 EVENTS & EARNINGS

### Wednesday, July 29 — FOMC DAY

🏦 2:00 PM ET: FOMC decision

🎙️ 2:30 PM ET: Warsh press conference

BMO: Memory/storage reports this morning — headline results generally constructive

AMC: $MSFT · $META · $ARM · $QCOM

🧬 The question tonight is not simply whether the mega-caps beat.

It is whether they all react the same way.

Correlation has been the shock absorber — semis down, other groups up, index relatively contained. If the big weights suddenly pull in the same direction, the absorber stops absorbing.

Flat is not calm.

Flat is two forces of equal size pulling opposite directions.

When one lets go, the tape does not drift.

It jumps.

### Thursday, July 30

⏰ 8:30 AM ET: Q2 GDP · Jobless Claims · PCE / Personal Income & Outlays

AMC: $AAPL · $AMZN

Two o’clock. Two-thirty. Earnings. Then GDP and PCE tomorrow morning.

No shortage of reasons for the front end to stay interesting.

---

## 📏 LEVELS & LINES — FREE

Reference: $SPX 7425

📐 RANGES

Tuesday: 7383 low → 7452 high → 7428.78 close

Recent range: 7382 low → 7489 high

Four recent tests around 7400. Four closes back above.

🎯 EXPECTED MOVES

Wednesday 0DTE FOMC: 59.45 → 7365 ↔ 7485

Friday / EOM: 105.80 → 7315 ↔ 7535

Today’s 1.0x span is roughly 120 points.

And on FOMC day, those rails are references — not fences.

📊 STRUCTURE

🧱 7500 · round number / larger overhead cap

📈 7485–7490 · 0DTE EM top / Monday high

🧱 7465–7475 · upper gate / MA neighborhood / first larger upside decision

🧲 7435 · immediate pivot / control area

📦 7400 · four-test floor / major line in the sand

📦 7385 · recent low area

📉 7365 · 0DTE EM bottom

The immediate pre-Fed box is narrower:

7435–7465.

That is where I expect the market to spend time if everyone decides to stare at the clock until 2:00.

But the positioning behind it is not narrow.

🧬 Market makers are broadly short gamma above and below spot, with alternating strike concentrations creating another two-way fishbone pattern.

That means the structure can do two apparently contradictory things:

Before the Fed, event IV and waiting can suppress realized movement and keep price chopping inside a smaller box.

After the Fed, the same short-gamma structure can amplify a break, produce a violent failure, or send the first move straight back through the range in the opposite direction.

Today the first move is information.

It is not a marriage proposal.

🔒 FULL EXECUTION MAP

The free map tells you where the fight is. Premium gives you the full fishbone structure, volatility framework, 0DTE IF/THEN Road Map, TradingView strings and Cheat Card.

Trade today’s market. Understand tomorrow’s.

Daily preparation. Lasting market education.

Subscribe:

— PAYWALL —

## 📏 LEVELS & LINES

Reference: $SPX 7425

### 🎯 EXPECTED-MOVE FRAME

1.0x: 7365 ↔ 7485

About 1.5x: 7335 ↔ 7515

Friday / EOM: 7315 ↔ 7535

The 1.0x rail is the number we publish.

Beyond that, the multiples are distance markers. Structure gets the tie.

### 🧱 7535 · FRIDAY EM TOP

Larger event extension.

Not today’s first problem, but absolutely reachable if FOMC creates a true short-gamma chase.

### 🧱 7500–7515 · ROUND / UPPER FISHBONE / 1.5x AREA

7500 is the obvious round number.

Above it, the fishbone continues toward roughly 7515, the practical 1.5x upside distance.

A clean hold above 7500 changes the character of the session.

### 📈 7485–7490 · 0DTE EM TOP / PRIOR HIGH

7485 is today’s upper EM rail.

7489 is Monday’s high.

That is real confluence and the first major FOMC upside test.

A hit is not the same thing as a hold. In short gamma, this is exactly the kind of area where price can either accelerate through or violently fail back.

### 🧱 7465–7475 · UPPER GATE

7465 is the first structural gate above the immediate chop zone, with the moving-average neighborhood sitting just overhead around 7470–7475.

Pre-Fed, this is a good place for the tape to stall and rotate.

Post-Fed, a hold above it opens 7485/90 quickly.

### 🧲 7435 · PIVOT / CONTROL

The immediate center of the market.

The chart keeps returning to the 7430s, and it separates the pre-Fed upper box from the larger 7400 test underneath.

Above it, 7465 remains live.

Lose it and 7425 → 7400 comes back into play.

### 📦 7400 · MAJOR FLOOR / FOUR-TEST LINE

This is the line the market has already voted on four times.

It does not have to hold a fifth.

But until it actually fails and stays failed, I am not going to declare it broken because of one FOMC wick.

### 📦 7385 · RECENT LOW / FISHBONE RUNG

Tuesday’s low area and the first meaningful downside rung below 7400.

If 7400 fails and 7385 cannot stabilize the move, the daily EM bottom gets very close very quickly.

### 📉 7365 · 0DTE EM BOTTOM

Today’s lower expected-move rail.

In a broadly short-gamma matrix, I treat this as a destination first, then ask whether price can actually hold or reclaim it.

### ⏸ 7335 · LOWER FISHBONE / 1.5x AREA

Practical 1.5x downside distance and another deeper strike concentration.

This is where ordinary FOMC extension starts becoming something larger.

### 📉 7315 · FRIDAY / EOM EM BOTTOM

Larger downside event reference.

### 🐟 TWO-WAY FISHBONE

The useful rungs today:

Upside:

7435 → 7465 → 7485/90 → 7500 → 7515 → 7535

Downside:

7435 → 7400 → 7385 → 7365 → 7335 → 7315

The positioning remains broadly short gamma across both sides.

The local rungs can stall, catch or reverse a move.

They do not change the larger regime.

---

## 🌡️ VOLATILITY & POSITIONING

This is a different 0DTE session before and after 2:00.

### BEFORE THE FED

IV has a reason to stay bid because the event is unresolved.

That can produce the annoying combination for premium sellers: price chops, but theta does not come out of the chain the way you expect.

For an iron condor seller, this is not the morning to assume the passage of time is your edge.

Minimal decay plus short gamma plus a scheduled 2:00 catalyst is not my favorite place to get comfortable.

This is a scalp day.

Or a sit-on-my-hands day.

### AFTER 2:00

Once the unknown becomes known, Fed event premium can come out quickly.

IF the decision and language are close to what is priced, THEN IV crush can help pull price back toward structure after the first impulse.

IF the Fed surprises or the language changes the path of rates, THEN negative gamma can overwhelm the vol crush and extend price through several fishbone rungs.

That is the important distinction:

IV coming out does not automatically mean price stops moving.

### AFTER 2:30

The press conference can invalidate the first move.

Then, just when the market thinks the event is over, $MSFT and $META arrive after the close, followed by GDP and PCE Thursday morning.

Fed premium can leave.

Event premium does not necessarily leave with it.

---

## 🗺️ $SPX ROAD MAP — 0DTE

### 🔄 CHOP ZONE — 7435–7465

7435 is the working pivot.

IF 7435 holds, THEN rotation toward 7465 remains the first path.

IF 7465 rejects and price falls back inside, THEN 7435 comes back into play.

IF 7435 fails and cannot reclaim, THEN 7425 → 7400 opens.

Before 2:00, this is the box where I expect boredom to do most of its work.

### 📈 ABOVE CHOP

IF 7465 clears and holds, THEN 7485–7490 is the first major test.

IF 7485/90 converts, THEN 7500 opens.

IF 7500 holds, THEN 7515 becomes the next fishbone rung.

Above 7515, 7535 is the larger Friday EM reference.

IF an upside FOMC spike clears one of these levels and immediately falls back inside, THEN treat the failure seriously. Short gamma amplifies the move in both directions.

### 📉 BELOW CHOP

IF 7435 fails, THEN 7425 → 7400.

IF 7400 holds or undercuts and reclaims, THEN reverse-test toward 7425 → 7435.

IF 7400 fails and cannot reclaim, THEN 7385 opens.

IF 7385 fails, THEN 7365 EM bottom becomes the next major test.

IF 7365 converts, THEN 7335 opens.

Below 7335, 7315 becomes the larger event reference.

### ⏰ TIME OF DAY

Before 2:00:

Scalp the locations or sit on your hands.

2:00–2:30:

Expect the first impulse, the failure of the first impulse, or both.

After 2:30:

Let Warsh finish the sentence before marrying the move.

FOMC is where attachment becomes expensive.

---

## 🔎 ADDITIONAL CONSIDERATIONS

📊 Breadth carried Tuesday while semis struggled. If that rotation continues, the index can remain deceptively contained.

🧬 If semis and mega-cap software suddenly align in the same direction, correlation rises and the index becomes a different animal.

🌡️ Watch IV with price. Expanding IV plus a converted level favors extension. Falling IV plus a failed level favors rotation.

🧘 This is not a prediction day.

It is a location day.

Wicks are not converted levels.

The hold is what matters.

---

## 📺 TRADINGVIEW STRINGS

MAIN

$SPX: Fri EM bot, 7315, FOMC EM bot, 7365, major floor, 7400, pivot, 7435, upper gate, 7465, FOMC EM top, 7485, round, 7500, Fri EM top, 7535

$ES1!: Fri EM ref, 7350, FOMC EM ref, 7400, major floor, 7435, pivot, 7465, upper gate, 7500, prior high, 7525, round, 7530, Fri EM ref, 7570

$SPY: major floor, 737.50, reaction, 740.00, control, 743.85, upper gate, 745.00, prior high, 746.50, upper stretch, 751.50

SCALPER

$SPX: 1p5 EM bot, 7335, FOMC EM bot, 7365, prior low, 7385, major floor, 7400, EM ref, 7425, pivot, 7435, upper gate, 7465, FOMC EM top, 7485, prior high, 7490, round, 7500, 1p5 EM top, 7515

$ES1!: 1p5 EM ref, 7370, FOMC EM ref, 7400, prior low, 7415, major floor, 7435, control, 7465, upper gate, 7500, FOMC EM ref, 7520, round, 7530, 1p5 EM ref, 7550

$SPY: lower stretch, 731.50, FOMC ref, 734.50, prior low, 735.85, floor, 737.50, reaction, 740.00, control, 743.85, upper gate, 745.00, prior high, 746.50, upper stretch, 749.50

---

## 🪪 CHEAT CARD

🧱 7535 · Friday EM top

🧱 7500 · round / upper cap

📈 7485–7490 · FOMC EM top / prior high

🧱 7465 · upper gate

🧲 7435 · pivot / control

📦 7400 · major four-test floor

📦 7385 · recent low

📉 7365 · FOMC EM bottom

⏸ 7335 · lower 1.5x area

📦 7315 · Friday EM bottom

QUICK IF

Above 7465 → 7485/90 → 7500 → 7515

Below 7435 → 7400 → 7385 → 7365

Inside 7435–7465 → scalp it or leave it alone until the Fed.

🌡️ First Vol Tell: IV likely stays bid into 2:00. After the decision, watch whether vol crush produces rotation or negative gamma overwhelms it and extends the move.

📅 Event Risk: FOMC 2:00 → Warsh 2:30 → $MSFT/$META/$ARM/$QCOM after close → GDP/PCE Thursday 8:30.

---

🔁 If the Daily Plan helped you see the structure underneath today’s tape, share or restack it.

Trade today’s market. Understand tomorrow’s.

Daily preparation. Lasting market education.

QUANTUITION — Analytics combined with Edge from Experience.

Gotta WATCH the FLOW to be in the KNOW.

file_dyUPZCzZ0TQLE
file_fZe2Ril4nssJo
file_JDrG2ZRNlzgCn